Addressing Missouri's Ongoing Financial Challenges
Explore the recurring financial challenges facing Missouri in FY2021, including stagnant state appropriations, Medicaid growth, and ranking last in revenue per FTE student. The state is grappling with restructuring to meet its financial reality amidst a backdrop of limited resources and economic constraints.

Download Presentation

Please find below an Image/Link to download the presentation.
The content on the website is provided AS IS for your information and personal use only. It may not be sold, licensed, or shared on other websites without obtaining consent from the author. If you encounter any issues during the download, it is possible that the publisher has removed the file from their server.
You are allowed to download the files provided on this website for personal or commercial use, subject to the condition that they are used lawfully. All files are the property of their respective owners.
The content on the website is provided AS IS for your information and personal use only. It may not be sold, licensed, or shared on other websites without obtaining consent from the author.
E N D
Presentation Transcript
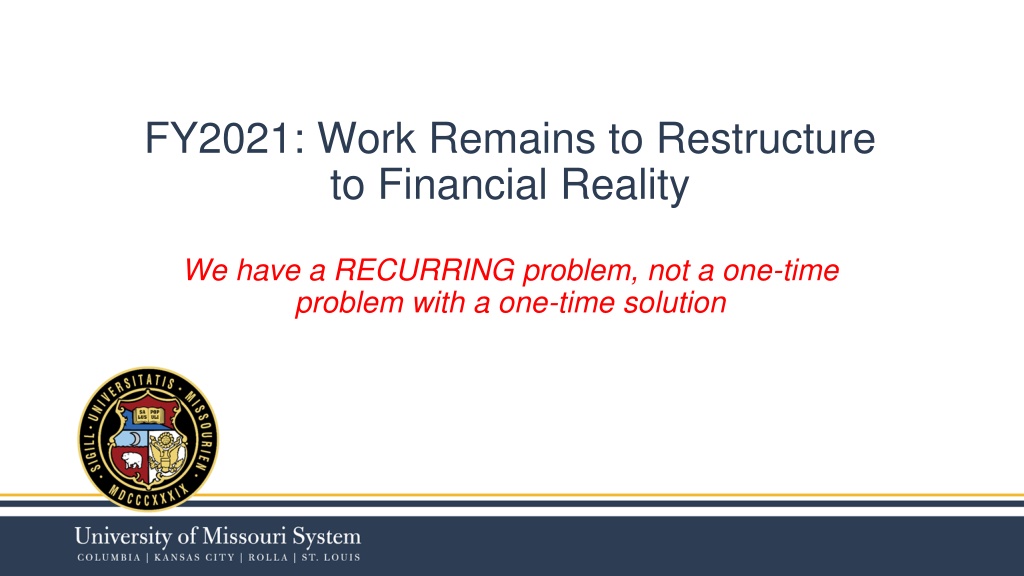
FY2021: Work Remains to Restructure to Financial Reality We have a RECURRING problem, not a one-time problem with a one-time solution
State Support Looking Back and Going Forward 2
State revenue will be challenged 500,000,000 Only drop without preceding recession 450,000,000 400,000,000 State Appropriations $ 350,000,000 300,000,000 250,000,000 200,000,000 150,000,000 Appropriations 100,000,000 50,000,000 Shaded portions represent economic recession - State appropriations have not grown our largest priority has only received $8M over the past three years
Revenues remain well below Hancock limits The Hancock Amendment (1981) set a threshold on total tax revenue based on the personal income of Missourians Threshold value of 5.64% has not been exceeded since 1998 Hancock Amendment also requires voter approvals of new taxes not in effect prior to 1981 4
Medicaid continues to grow Medicaid Portion of State Budgets 45% 39% 40% 35% 35% 29% 30% 26% 25% 20% 20% 15% 13% 10% 8% 5% 0% 1985 1990 2000 2014 2019 National MO In 2019, Medicaid consumed 39% of Missouri s budget. On a percentage basis, no other state spent more on Medicaid. (Source National Association of State Business Officers) 5
Missouri Ranks Last in Revenue per FTE Student Growth Since the Great Recession (through 2017) 50.0% Over this timeframe, Missouri ranks 50thin growth in tuition per student and 42ndin growth in state support per student. 40.0% 30.0% 20.0% 10.0% Missouri was one of two states to see a decline in both state support and tuition. 5.8% 0.0% -10.0% From 2016 to 2017, Missouri saw the largest annual drop in total revenues per student at 8.4%. -20.0% -30.0% ARKANSAS NEBRASKA WYOMING WASHINGTON MAINE NEW JERSEY RHODE ISLAND NEW HAMPSHIRE ALASKA IOWA MARYLAND UTAH TEXAS CONNECTICUT MONTANA DELAWARE MISSOURI FLORIDA MASSACHUSETTS IDAHO U.S. HAWAII MICHIGAN COLORADO LOUISIANA MINNESOTA CALIFORNIA INDIANA OKLAHOMA NORTH CAROLINA WISCONSIN KANSAS SOUTH CAROLINA NEW MEXICO WEST VIRGINIA PENNSYLVANIA ALABAMA VERMONT SOUTH DAKOTA OREGON NORTH DAKOTA MISSISSIPPI GEORGIA KENTUCKY OHIO TENNESSEE VIRGINIA NEVADA ARIZONA NEW YORK ILLINOIS Source: SHEEO
Real Resources per Student has Changed in Proportion and is Declining Real Approps per Student Real Tuition per Student State Investment + Enrollment Growth State Slow Decline + Enrollment Growth State Slow Growth + Enrollment Maintenance 25,000 Shaded portions represent economic recession 20,000 15,000 10,000 5,000 - 1965 1966 1967 1968 1969 1970 1971 1972 1973 1974 1975 1976 1977 1978 1979 1980 1981 1982 1983 1984 1985 1986 1987 1988 1989 1990 1991 1992 1993 1994 1995 1996 1997 1998 1999 2000 2001 2002 2003 2004 2005 2006 2007 2008 2009 2010 2011 2012 2013 2014 2015 2016 2017 2018 2019 2020
Higher Education continues to be crowded out Downward adjustments have continued: Missouri dropped higher education spend by 4.2% in FY 2018 and by 4.4% in FY 2019 Nationally, states increased higher education spending by 2.6% in FY 2018 and 3.5% in FY 2020 For FY2019, Missouri spent 4.2% of the state budget on higher education, compared to a national average of 10.1% Missouri spends above average on K-12 education and Medicaid, and below average across all other categories
We have a RECURRING problem, not a one-time problem with a one-time solution The pandemic only accelerated trends we are already experiencing 9
Enrollments have been falling for 5 years 10 Year Change in Enrollment 40% 30% 20% 10% 0% -10% -20% -30% 2010 2011 2012 2013 2014 2015 2016 2017 2018 2019 2020 2021 First Day UMSL UMKC S&T MU 10
The only significant revenue growth has come from healthcare From 2016-2020: Net tuition dropped $48M State appropriations dropped $75M Grants grew by $44M Giving & Endowment income grew $30M $4,000 Millions -1.4% 4.5% $169 2.2% 1.2% $3,500 $3,000 $1,346 $1,355 $1,250 $1,180 $1,054 $2,500 $2,000 $280 $290 $309 $292 $1,500 $324 $439 $418 $402 $409 $364 $1,000 $429 $420 $408 $408 $369 $500 $659 $633 $623 $614 $611 $0 FY 2016 FY 2017 FY 2018 FY 2019 FY2020 Preliminary Net Tuition and Fees State Appropriations Private Gifts and Investment Income Patient Medical Services Net Auxiliary Enterprises Grants and Contracts Other Operating Revenues Operating Revenues Lost 11
MU Experienced an Outsized Impact 1,600 From 2016-2020: Net tuition dropped $71M State appropriations dropped $36M Grants grew by $22M Giving & Endowment income grew $17M Millions 80 -2.0% -2.2% 2.4% -1.2% 1,400 192 224 204 202 227 1,200 116 116 132 135 133 1,000 197 205 210 205 219 800 224 212 202 208 188 600 307 296 290 297 288 400 200 341 318 302 288 270 - FY 2016 FY 2017 FY 2018 FY 2019 FY 2020 Net Tuition and Fees State Appropriations Private Gift and Investment Income Patient Medical Services Net Auxiliary Enterprises Grants & Contracts Other Operating Revenues Operating Revenues Lost 12
Since the Pandemic Budgeted revenue decline of $115M over FY2019 in the academic enterprise oState withholding and stabilization drops core by $55M oDeclining tuition and auxiliary revenues on declining enrollments oBudget looks more like a recurring problem than a one-time problem Additional exposure of $120M-$320M if further disruptions occur during FY2021 oWould not have to shut down campus again, could be driven by students slowing consumption oRequires significant action to stem the resource consumption 13
Stimulus provided one-time support $34 million from CARES direct institutional dollars o$17M had to be issued as aid to students o$17M covered costs of refunds and other shut down costs Additional $49 million available from the state for costs to reopen oOnly for unbudgeted costs incurred from the pandemic oWill help with one-time response oBut does not solve the recurring budget hole 14
Much of the action taken to date has been one-time, won t fix recurring problem Consolidated Academic Units Change $ % FY2019 FY2020 Business Meeting Expenses 15,559 11,922 (3,636) -23% Travel and Training 60,196 42,616 (17,579) -29% Non Capital Equipment 61,005 51,631 (9,374) -15% The 4 Universities reported a $56M decrease in Supplies Services and Other Expense The three categories above make up themajority of the savings 15
Current payroll actions will not generate recurring savings MU UMKC UMSL Action S&T System Admin 52 Total Temporary Pay Decrease 1,485 955 793 13 3,298 One- time savings Short-Term Furlough (< 1 week) Long-Term Furlough 1,791 119 46 48 92 2,096 259 9 107 30 3 408 Layoff 151 38 57 34 24 304 Total 3,686 1,121 1,003 125 171 6,106 The majority of realized savings from payroll are one time in nature Only 5% of actions have permanently reduced workforce 16
The Majority of Staff is not Central Columbia Chancellor 4 VC Inclusion-Diversity-Equity 39 VC Strategic Comm & Marketing 51 VC HR & Finance Svcs 101 VC Advancement 133 Extension 145 VCVP Information & Access Tech Svcs 290 Vice Chancellor Student Affrs 311 Intercollegiate Athletics 340 RSCH, Grad Studies & Econ Dev 371 Provost 509 Campus Operations 1,233 Schools & Colleges 2,196 0 500 1,000 1,500 2,000 2,500 FTE 17
Areas of higher spend is generally driven by distributed/decentralized spend 18
Where do we go from here to solve our recurring problems? Business as usual will not work and WE ALL have to be part of the solution 19
The System does not have resources Investment income and State Appropriations currently allocated to System will be distributed equitably to campuses beginning in FY 22 System will provide administrative and compliance services at scale efficiently System services will work as a cost center and each campus will be allocated an equitable share of the cost
The role of System will change The System will shift to a cost center rather than a resource allocator Provides services at scale Regulation will need to change less regulation as it relates to academic programs and the pursuit of mission System can t solve resource problems oAllocated resources (State support, investment income, etc) are no longer available oAt best, state support will decline slightly or remain flat but will be more directed rather than broad based in the future 21
FY 20 Actions were only the beginning The 12.5% cuts are likely to be maintained in many areas to deal with likely recurrence of state cuts Investments that have revenue generation potential will be key to coming out of the crisis Enrollment remains a key. Every 1% change in enrollment generates $2.7M in tuition revenue Auxiliary revenues have a number of drivers other than enrollment will be key to ensure they operate in financial sustainable ways. 22
Challenge to the University Remains GROW REVENUE AND PRIORTIZE MISSION! We can t cut our way to greatness oBut we can spend our way to bankruptcy if revenues don t change oNecessary cuts are a result of the paradigm shift in revenues Past growth strategies will not work oState revenues will remain challenged, even with significant support we enjoy oTraditional tuition rates and enrollments subject to market forces New, paying students/learners and programs to serve them are the key to our future Focus on productivity while growing if we want the best faculty we need the paying students to support them Administrative cost cutting can not solve the entirety of the shortfall
What do Academic Leaders need to do? YOU control your destiny with revenues oEnrollment oResearch oPhilanthropy Think of spend in terms of resource generation and mission Prioritize those activities that directly support teaching and research Understand your budget and how it works align incentives to how resources are produced omarket (what people demand) omission (how it relates to our core purpose) omargin (how much money we make/consume on the activity) 24
Higher Education faces significant revenue risks Citing the "incredible financial cost" associated with not fully reopening its campus this fall, UMass Amherst Chancellor Kumble Subbaswamy has calculated nearly $169 million in budget losses and is now placing 850 workers, including dining and residence hall staff, on indefinite furloughs effective Sept. 13 o $67.4M in housing and dining revenue o $30.6M decline in tuition revenue o $20.9M reduction in grant and contract overhead income o $36.7M in 10% hold back for expected reductions in state support o $13M in virus testing, safety, isolation and quarantine measures If MU faced a shortfall of $169M in revenue, what would that represent in terms of faculty and or staff positions that need to be considered for separation? o Average faculty salary and benefits = $83K + $27K = ~1,500 faculty positions o Average staff salary and benefits = $55K + $20K = ~2,200 staff positions 25