2018 Low Income Housing Tax Credit Results & Applications


2018 Low Income Housing Tax
Credit Results
May 2018


2018 Credit Set-Asides
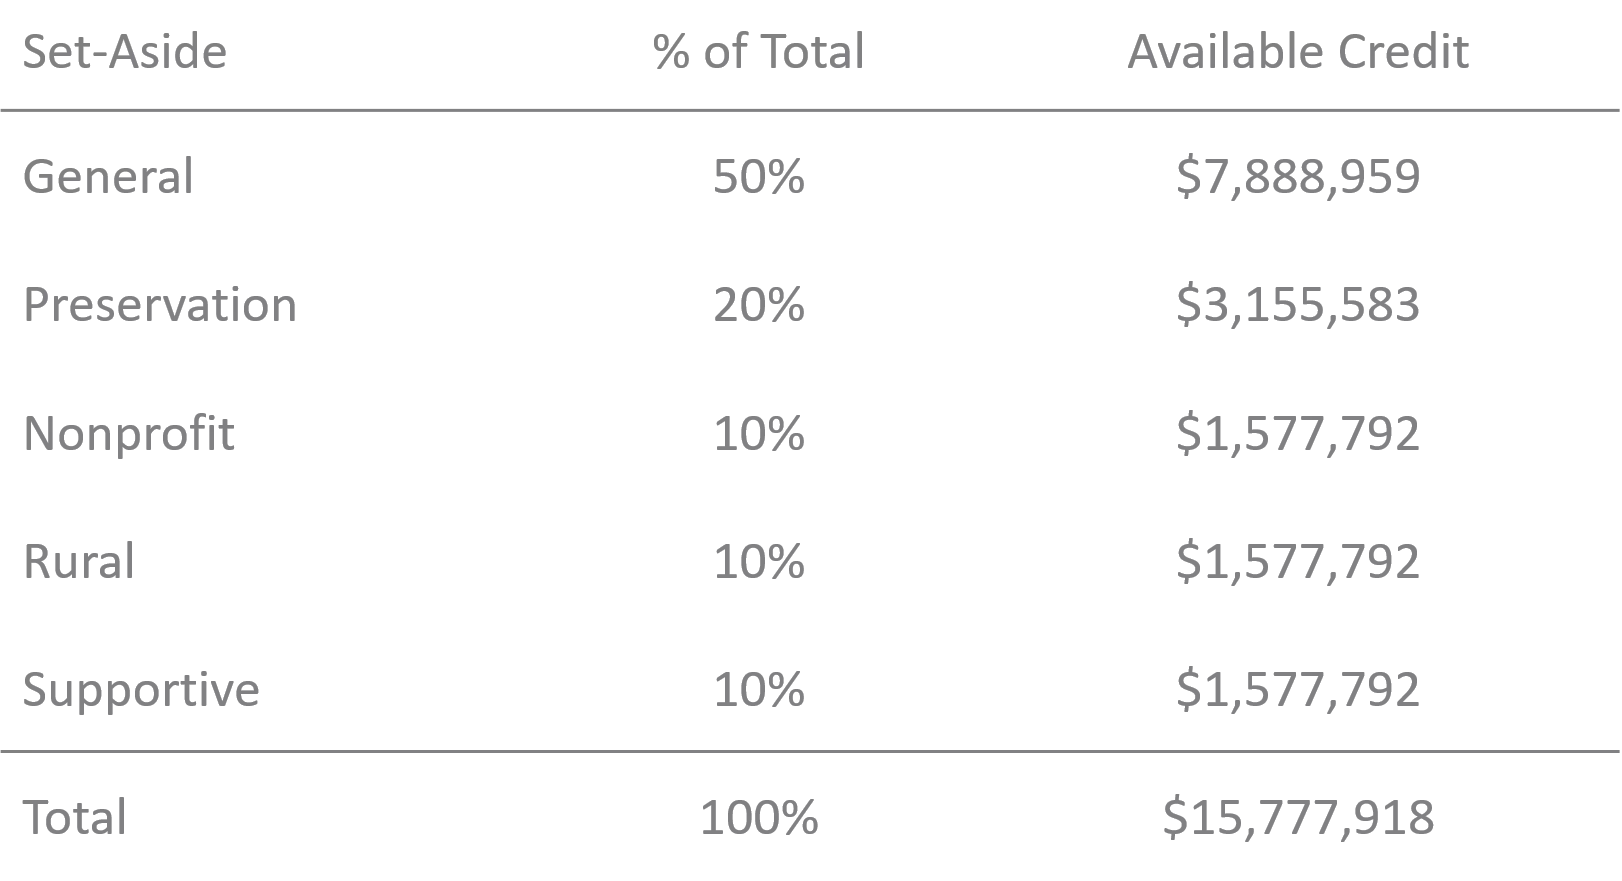
Note: These credit figures include 12.5% increase from the Omnibus Spending bill and an increase from the
updated State of Wisconsin Per-Capita population adjustment.
2018 Sources of Available Credit
•
Approximately $15.77 million of competitive
credit was available in the 2018 LIHTC cycle
•
Through the competitive scoring process, WHEDA incents
developers to maximize financial participation and credit usage
points. This creates a condition where developments request
less LIHTC than they would be entitled to by the eligible basis
calculation. The amount of LIHTC leverage created through this
mechanism was an additional $1,953,247 or 13%.
Note:
Additional Credit Applications were excluded from
this leverage calculation.
•
Sources:
•
Annual Per-Capita Allocation
$15,647,804
•
Unused 2017 Credits
$86,270
•
Returned Credits
$43,844
2018 LIHTC Applications
•
51 applications in total, including 9 for additional credit,
were submitted for developments in 40 Wisconsin
communities, including:
•
Milwaukee (8),
includes 2 additional credit
•
Madison (6),
includes 2 additional credit
•
River Falls (3)
•
Green Bay (2) and Wisconsin Rapids (2)
Note: WHEDA received 3 scattered site applications that served eight distinct
municipalities.
2018 LIHTC Awards
•
During the competitive 9% 2018 cycle, LIHTC awards
were made to properties in 23 Wisconsin communities,
including Milwaukee (5), and Madison (6)
•
The 32 LIHTC awards will assist in the development or
rehabilitation of 1,766 residential units – including 1,583
affordable units
•
The 32 projects represent more than $322 million of
construction, rehabilitation and related soft costs
2018 Applications & Awards
Average 2018 LIHTC Requests & Awards
Note:
Additional Credit Applications were excluded from these calculations.
Household Type - 2018
Note:
Additional Credit Applications were excluded from these calculations.
Construction Type - 2018
Note:
Additional Credit Applications were excluded from these calculations.
Average Project Size (# units)
Average, Per-Low Income Unit Development
Budgets
2018 LIHTC Scoring
Results
Scoring Summary
•
Scoring Categories: 14
•
Maximum Score: 284
•
Minimum Eligible Score: 120
•
Average Scores
•
All Applications: 199
•
Applications Receiving Awards: 202
•
Applications Not Receiving Awards: 192
Differences: Those that Did, or Didn’t Receive
an Award
•
The average application receiving an LIHTC award scored 10 more points than
the average application that didn’t receive an award.
•
Categories in which awarded applications scored notably more points:
•
Financial Participation (+6.5 points)
•
Credit Usage (+1.9 points)
•
Development Team (+1.6 points)
•
Serves Lowest Income Residents (1.3 points)
Differences: Those that Did, or Didn’t Receive
an Award (Continued)
•
WHEDA restricts certain projects from being able to score in certain point
categories for the following:
•
Applying in the Preservation Set-Aside
•
Applying in the Supportive Housing Set-Aside
•
Maintaining federal operating subsidies
•
Scoring points in other point categories
This can skew point averages in certain categories year over year
depending on how many applications subject to the restrictions are
received.
2018 Scoring Cut-Offs
•
General
220
•
Preservation
124
•
Nonprofit
201
•
Rural
213
•
Supportive
176
Category 1
Lower Income Areas
•
Points Available: 0 or 5
•
Applications Receiving Points: 15 (29%)
•
Average Score
•
All Applications(51): 1.5
•
Applications-Receiving points (15): 5.0
•
Applications Receiving Awards (32): 0.9
•
Applications Receiving Awards-Receiving points (6): 5.0
•
Applications Not Receiving Awards (18): 2.5
•
Applications Not Receiving Awards-Receiving points (9): 5.0
Category 2
Energy Efficiency & Sustainability
•
Points Available: Up to 32
•
Applications Receiving Points: All
•
Average Score
•
All Applications(51): 27.8
•
Applications Receiving Awards(32): 27.9
•
Applications Not Receiving Awards(18): 28.0
Category 3
Mixed-Income Incentive
•
Points Available: Up to 12
•
Applications Receiving Points: 36 (71%)
•
Average Score
•
All Applications(51): 7.2
•
Applications-Receiving points (36): 10.2
•
Applications Receiving Awards (32): 6.9
•
Applications Receiving Awards-Receiving points (22): 10.0
•
Applications Not Receiving Awards (18): 7.5
•
Applications Not Receiving Awards-Receiving points (13): 10.4
•
Supportive Housing Set-Aside applications were not
allowed to score points in this category
Category 4
Serves Large Families
•
Points Available: Up to 5
•
Applications Receiving Points: 30 (59%)
•
Average Score
•
All Applications(51): 2.9
•
Applications-Receiving points (30): 4.9
•
Applications Receiving Awards (32): 3.1
•
Applications Receiving Awards-Receiving points (20): 4.9
•
Applications Not Receiving Awards (18): 2.5
•
Applications Not Receiving Awards-Receiving points (9): 5.0
•
Supportive Housing Set-Aside applications, and elderly
developments, were not allowed to score points in this
category
Category 5
Serves Lowest-Income Residents
•
Points Available: Up to 60
•
Applications Receiving Points: 40 (78%)
•
Average Score
•
All Applications(51): 46.7
•
Applications-Receiving Points (36): 59.5
•
Applications Receiving Awards (32): 46.9
•
Applications Receiving Awards-Receiving Points (25): 60.0
•
Applications Not Receiving Awards (18): 45.6
•
Applications Not Receiving Awards-Receiving points (14): 58.6
•
Preservation Set-Aside applications were not allowed to
score points in this category
Category 6
Supportive Housing
•
Points Available: 0, 15 or 20
•
Applications Receiving Points: 48 (94%)
•
Average Score
•
All Applications(51): 18.6
•
Applications-Receiving Points(48): 19.8
•
Applications Receiving Awards (32): 18.6
•
Applications Receiving Awards-Receiving Points (30): 19.8
•
Applications Not Receiving Awards (18): 18.6
•
Applications Not Receiving Awards-Receiving Points (17): 19.7
•
Supportive Housing Set-Aside applications, and those receiving points
in Category 8, were not allowed to score points in this category
Category 7
Rehab/Neighborhood Stabilization
•
Points Available: 0 or 25
•
Applications Receiving Points: 1 (2%)
•
Average Score
•
All Applications(51): 0.5
•
Applications Receiving Awards (1): 25
•
Applications Not Receiving Awards (18): 0
•
Supportive Housing Set-Aside applications, and those
receiving points in Category 13, were not allowed to
score points in this category
Category 8
Universal Design
•
Points Available: Up to 18
•
Applications Receiving Points: All
•
Average Score
•
All Applications(51): 17.9
•
Applications Receiving Awards(32): 18.0
•
Applications Not Receiving Awards(18): 17.8
Category 9
Financial Participation
•
Points Available: Up to 25
•
Applications Receiving Points: 46 (90%)
•
Average Score
•
All Applications (51): 14.4
•
Applications-Receiving Points (46): 16.0
•
Applications Receiving Awards (32): 16.8
•
Applications Receiving Awards-Receiving Points (30): 17.9
•
Applications Not Receiving Awards (18): 10.3
•
Applications Not Receiving Awards-Receiving Points (15): 12.3
Category 10
Eventual Tenant Ownership
•
Points Available: 0 or 3
•
Applications Receiving Points: None
•
Average Score
•
All Applications(51): N/A
•
Applications Receiving Awards(32): N/A
•
Applications Not Receiving Awards(18): N/A
•
Supportive Housing Set-Aside applications were not
allowed to score points in this category
Category 11
Development Team
•
Points Available: Up to 12
•
Applications Receiving Points: All
•
Average Score
•
All Applications(51): 8.7
•
Applications Receiving Awards(32): 9.3
•
Applications Not Receiving Awards(18): 7.7
Category 12
Readiness to Proceed
•
Points Available: 0 or 12
•
Applications Receiving Points: 50 (98%)
•
Average Score
•
All Applications (51): 11.8
•
Applications Receiving Awards (32): 12.0
•
Applications Not Receiving Awards (18): 11.3
Category 13
Credit Usage
•
Points Available: Up to 30
•
Applications Receiving Points: 50 (98%)
•
Average Score
•
All Applications(51): 24.1
•
Applications-Receiving Points(50): 24.5
•
Applications Receiving Awards (32): 24.6
•
Applications Receiving Awards-Receiving Points (31): 25.4
•
Applications Not Receiving Awards (18): 22.7
•
Applications Not Receiving Awards-Receiving Points (18): 22.7
•
Applications receiving points in Category 7 were not allowed to
score points in this category
Category 14
Opportunity Zones
•
Points Available: Up to 25
•
Applications Receiving Points: 51 (100%)
•
Average Score
•
All Applications(51): 15.5
•
Applications Receiving Awards (32): 15.7
•
Applications Not Receiving Awards (18): 14.8
Additional Information
•
A detailed list of 2018 Low Income Housing Tax
Credit applications and awards can be found on
www.wheda.com
The results and applications of the 2018 Low Income Housing Tax Credit cycle in Wisconsin, including credit set-asides, available credit sources, applications, and awards. Learn about the developments, communities, and units benefiting from the LIHTC program.

Download Presentation

Please find below an Image/Link to download the presentation.
The content on the website is provided AS IS for your information and personal use only. It may not be sold, licensed, or shared on other websites without obtaining consent from the author.If you encounter any issues during the download, it is possible that the publisher has removed the file from their server.
You are allowed to download the files provided on this website for personal or commercial use, subject to the condition that they are used lawfully. All files are the property of their respective owners.
The content on the website is provided AS IS for your information and personal use only. It may not be sold, licensed, or shared on other websites without obtaining consent from the author.
E N D
Presentation Transcript
2018 Low Income Housing Tax Credit Results May 2018
2018 Credit Set-Asides Set-Aside % of Total Available Credit General 50% $7,888,959 Preservation 20% $3,155,583 Nonprofit 10% $1,577,792 Rural 10% $1,577,792 Supportive 10% $1,577,792 Total 100% $15,777,918 Note: These credit figures include 12.5% increase from the Omnibus Spending bill and an increase from the updated State of Wisconsin Per-Capita population adjustment. 2
2018 Sources of Available Credit Approximately $15.77 million of competitive credit was available in the 2018 LIHTC cycle Through the competitive scoring process, WHEDA incents developers to maximize financial participation and credit usage points. This creates a condition where developments request less LIHTC than they would be entitled to by the eligible basis calculation. The amount of LIHTC leverage created through this mechanism was an additional $1,953,247 or 13%. Note: Additional Credit Applications were excluded from this leverage calculation. Sources: Annual Per-Capita Allocation Unused 2017 Credits Returned Credits $15,647,804 $43,844 $86,270 3
2018 LIHTC Applications 51 applications in total, including 9 for additional credit, were submitted for developments in 40 Wisconsin communities, including: Milwaukee (8), includes 2 additional credit Madison (6), includes 2 additional credit River Falls (3) Green Bay (2) and Wisconsin Rapids (2) Note: WHEDA received 3 scattered site applications that served eight distinct municipalities. 4
2018 LIHTC Awards During the competitive 9% 2018 cycle, LIHTC awards were made to properties in 23 Wisconsin communities, including Milwaukee (5), and Madison (6) The 32 LIHTC awards will assist in the development or rehabilitation of 1,766 residential units including 1,583 affordable units The 32 projects represent more than $322 million of construction, rehabilitation and related soft costs 5
2018 Applications & Awards Credit Available Credit Requested Credit Awarded Set-Aside Appl. Awards General $6,977,584 23 $16,008,879 13 $7,789,761 Preservation $2,791,033 11 $5,577,716 7 $2,881,126 Nonprofit $1,395,516 5 $1,887,737 4 $1,848,543 Rural $1,395,516 9 $2,872,471 6 $1,813,488 Supportive $1,395,516 3 $1,739,966 2 $1,376,966 Total $13,955,165 51 $28,140,769 32 $15,258,884 6
Average 2018 LIHTC Requests & Awards Average Credit Request Average Credit Award Set-Aside Total Per- LI Unit Total Per- LI Unit General $868,048 $15,067 $826,776 $14,852 Preservation $473,760 $7,592 $411,589 $9,572 Nonprofit $582,350 $9,147 $582,684 $9,152 Rural $538,821 $15,394 $561,630 $16,358 Supportive $597,989 $15,075 $688,483 $14,051 Total $681,989 $12,394 $630,501 $12,673 Note: Additional Credit Applications were excluded from these calculations. 7
Household Type - 2018 Average Credit Request Average Credit Award Household Type Appl Total Per-LI Unit Awards Total Per-LI Unit Family 21 $737,042 $13,832 16 $650,244 $14,078 Elderly 14 $651,767 $10,369 6 $483,358 $9,387 Supportive 4 $498,742 $13,571 2 $688,483 $14,051 Total 39 $681,989 $12,394 24 $630,501 $12,673 Note: Additional Credit Applications were excluded from these calculations. 8
Construction Type - 2018 Average Credit Request Average Credit Award Construction Type Appl Total Per-LI Unit Awards Total Per-LI Unit New Construction 20 $786,596 $14,513 12 $429,016 $14,589 Adaptive Reuse 8 $697,257 $16,503 4 $645,513 $15,369 Acquisition & Rehab 11 $480,691 $7,303 8 $383,209 $8,559 Total 39 $681,989 $12,394 24 $630,501 $12,673 Note: Additional Credit Applications were excluded from these calculations. 9
Average Project Size (# units) Set-Aside All Applications LIHTC Awards General 65 56 Preservation 61 43 Nonprofit 71 68 Rural 36 31 Supportive 40 49 Total 58 49 10
Average, Per-Low Income Unit Development Budgets All Applications LIHTC Awards Overall $199,275 $203,620 Acquisition & Rehab $122,150 $126,039 Adaptive Reuse $275,459 $244,409 New Construction $219,828 $227,543 11
2018 LIHTC Scoring Results
Scoring Summary Scoring Categories: 14 Maximum Score: 284 Minimum Eligible Score: 120 Average Scores All Applications: 199 Applications Receiving Awards: 202 Applications Not Receiving Awards: 192 13
Differences: Those that Did, or Didnt Receive an Award The average application receiving an LIHTC award scored 10 more points than the average application that didn t receive an award. Categories in which awarded applications scored notably more points: Financial Participation (+6.5 points) Credit Usage (+1.9 points) Development Team (+1.6 points) Serves Lowest Income Residents (1.3 points) 14
Differences: Those that Did, or Didnt Receive an Award (Continued) WHEDA restricts certain projects from being able to score in certain point categories for the following: Applying in the Preservation Set-Aside Applying in the Supportive Housing Set-Aside Maintaining federal operating subsidies Scoring points in other point categories This can skew point averages in certain categories year over year depending on how many applications subject to the restrictions are received. 15
2018 Scoring Cut-Offs General 220 Preservation Nonprofit Rural 201 124 213 Supportive 176 16
Category 1 Lower Income Areas Points Available: 0 or 5 Applications Receiving Points: 15 (29%) Average Score All Applications(51): 1.5 Applications-Receiving points (15): 5.0 Applications Receiving Awards (32): 0.9 Applications Receiving Awards-Receiving points (6): 5.0 Applications Not Receiving Awards (18): 2.5 Applications Not Receiving Awards-Receiving points (9): 5.0 17
Category 2 Energy Efficiency & Sustainability Points Available: Up to 32 Applications Receiving Points: All Average Score All Applications(51): 27.8 Applications Receiving Awards(32): 27.9 Applications Not Receiving Awards(18): 28.0 18
Category 3 Mixed-Income Incentive Points Available: Up to 12 Applications Receiving Points: 36 (71%) Average Score All Applications(51): 7.2 Applications-Receiving points (36): 10.2 Applications Receiving Awards (32): 6.9 Applications Receiving Awards-Receiving points (22): 10.0 Applications Not Receiving Awards (18): 7.5 Applications Not Receiving Awards-Receiving points (13): 10.4 Supportive Housing Set-Aside applications were not allowed to score points in this category 19
Category 4 Serves Large Families Points Available: Up to 5 Applications Receiving Points: 30 (59%) Average Score All Applications(51): 2.9 Applications-Receiving points (30): 4.9 Applications Receiving Awards (32): 3.1 Applications Receiving Awards-Receiving points (20): 4.9 Applications Not Receiving Awards (18): 2.5 Applications Not Receiving Awards-Receiving points (9): 5.0 Supportive Housing Set-Aside applications, and elderly developments, were not allowed to score points in this category 20
Category 5 Serves Lowest-Income Residents Points Available: Up to 60 Applications Receiving Points: 40 (78%) Average Score All Applications(51): 46.7 Applications-Receiving Points (36): 59.5 Applications Receiving Awards (32): 46.9 Applications Receiving Awards-Receiving Points (25): 60.0 Applications Not Receiving Awards (18): 45.6 Applications Not Receiving Awards-Receiving points (14): 58.6 Preservation Set-Aside applications were not allowed to score points in this category 21
Category 6 Supportive Housing Points Available: 0, 15 or 20 Applications Receiving Points: 48 (94%) Average Score All Applications(51): 18.6 Applications-Receiving Points(48): 19.8 Applications Receiving Awards (32): 18.6 Applications Receiving Awards-Receiving Points (30): 19.8 Applications Not Receiving Awards (18): 18.6 Applications Not Receiving Awards-Receiving Points (17): 19.7 Supportive Housing Set-Aside applications, and those receiving points in Category 8, were not allowed to score points in this category 22
Category 7 Rehab/Neighborhood Stabilization Points Available: 0 or 25 Applications Receiving Points: 1 (2%) Average Score All Applications(51): 0.5 Applications Receiving Awards (1): 25 Applications Not Receiving Awards (18): 0 Supportive Housing Set-Aside applications, and those receiving points in Category 13, were not allowed to score points in this category 23
Category 8 Universal Design Points Available: Up to 18 Applications Receiving Points: All Average Score All Applications(51): 17.9 Applications Receiving Awards(32): 18.0 Applications Not Receiving Awards(18): 17.8 24
Category 9 Financial Participation Points Available: Up to 25 Applications Receiving Points: 46 (90%) Average Score All Applications (51): 14.4 Applications-Receiving Points (46): 16.0 Applications Receiving Awards (32): 16.8 Applications Receiving Awards-Receiving Points (30): 17.9 Applications Not Receiving Awards (18): 10.3 Applications Not Receiving Awards-Receiving Points (15): 12.3 25
Category 10 Eventual Tenant Ownership Points Available: 0 or 3 Applications Receiving Points: None Average Score All Applications(51): N/A Applications Receiving Awards(32): N/A Applications Not Receiving Awards(18): N/A Supportive Housing Set-Aside applications were not allowed to score points in this category 26
Category 11 Development Team Points Available: Up to 12 Applications Receiving Points: All Average Score All Applications(51): 8.7 Applications Receiving Awards(32): 9.3 Applications Not Receiving Awards(18): 7.7 27
Category 12 Readiness to Proceed Points Available: 0 or 12 Applications Receiving Points: 50 (98%) Average Score All Applications (51): 11.8 Applications Receiving Awards (32): 12.0 Applications Not Receiving Awards (18): 11.3 28
Category 13 Credit Usage Points Available: Up to 30 Applications Receiving Points: 50 (98%) Average Score All Applications(51): 24.1 Applications-Receiving Points(50): 24.5 Applications Receiving Awards (32): 24.6 Applications Receiving Awards-Receiving Points (31): 25.4 Applications Not Receiving Awards (18): 22.7 Applications Not Receiving Awards-Receiving Points (18): 22.7 Applications receiving points in Category 7 were not allowed to score points in this category 29
Category 14 Opportunity Zones Points Available: Up to 25 Applications Receiving Points: 51 (100%) Average Score All Applications(51): 15.5 Applications Receiving Awards (32): 15.7 Applications Not Receiving Awards (18): 14.8 30
Additional Information A detailed list of 2018 Low Income Housing Tax Credit applications and awards can be found on www.wheda.com 31


")