Trends in Cycling: Historical Evolution and Impact of Pandemic


Historical trends


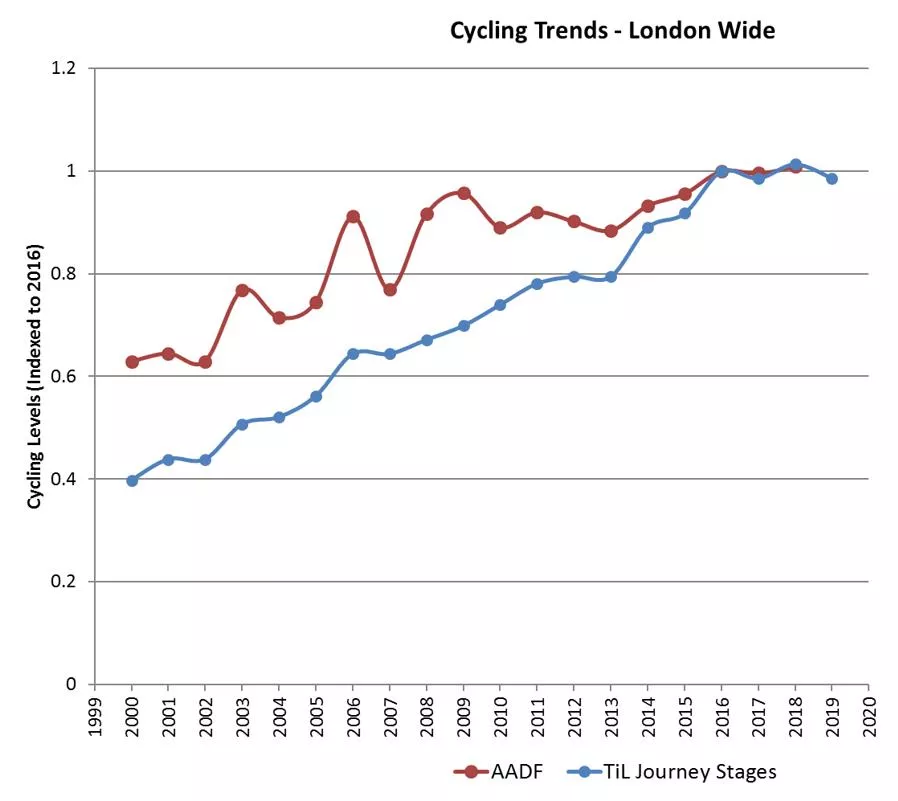
Cycling has doubled in the last 20 years


•
Significant growth in 2000-2015, partly driven by
a shift towards sustainable travel in the public
agenda and a subsequent boost in investment,
especially since 2010.
•
Cycling levels have been stable since, but this has
also been seen in the growth rate of population
and of travel demand in general.
•
Cycling is still a minor mode in relative terms.
Trip-based mode share was 1.2% in 2000; 2.0% in
2010 and 2.4% in 2019.
AADF: DfT Average Annual Daily Flow data (mix of counts & estimates)
TiL: Daily journey stages estimates based on LTDS data
Note: All growth numbers in these slides refer to growth in cycle trips, or
the overall amount of cycling on the network. Growth quoted in relation
to schemes is often significantly higher but is not comparable because it
includes rerouting of existing trips as well as mode shift.
The recent growth has been consistent across London
•
Similar trends to London-wide data
•
Possible indications of recent levelling-off of
cycling levels
•
Longer history of data reveals different trends in
inner and outer London pre-2000, with outer
London cycling decreasing and inner London
cycling remaining flat, before both start to grow
together in 2000
Cordons and screenlines are based on one day manual counts, making them
subject to day to day weather related variations in cycling demand
Cycling during the
pandemic
Weekend cycling has boomed during the pandemic while weekday cycling
has been fairly steady outside the lockdowns
•
Weekday cycling fell by ~60% in
the first lockdown, mostly
recovered for the rest of 2020
and fell again by ~50% in the
latest lockdown.
•
Changes in weekend cycling
were very variable, centred
around twice normal levels.
•
Total week cycling has thus
stayed level or slightly above
the previous year.
Changes are vs the same week the
previous year, so they do not necessarily
represent an absolute change compared to
other weeks of this year. This data is based
on 27 counters mostly in central London.
Weekday cycling has moved away from central London
•
Weekday cycle flows in autumn 2020 increased by 7% in inner London and 22% in outer London,
compared to spring 2019*.
•
This does not necessarily represent an increase in the number of people cycling, since changes in the
individual cycle frequency and the redistribution of existing flows also come into play, both of which
have been seen strongly during the pandemic.
•
In fact, weekday cycling flows from summer 2020 showed a 24% reduction in central London
(Congestion Charge zone) compared to the previous year. This suggests that part of the increase in
weekday cycle flows in inner and outer London could be displacement from cycling to or within
central London.
* Counts would normally take place in the same season (spring) but the first national lockdown forced the inner and outer counts to be postponed. The
results may therefore be affected by seasonality, but this would be a conservative estimate.
The panel of sites used in 2020 was a subset (of about 65%) of usual, but still representative of those areas. The results provided are like-for-like comparisons
and take this difference in the panels into account.
Further evidence suggest a temporal redistribution of cycling demand
away from the peaks
•
The weekday morning and evening peaks have reduced while inter-peak cycling has grown.
•
Weekends retain a single peak but this is larger in absolute and relative terms.
Cycling has witnessed significant growth over the past two decades, with a doubling in cycling levels from 2000 to 2015. This growth was partly fueled by a shift towards sustainable travel. However, recent data suggests a plateau in cycling levels. The pandemic led to a surge in weekend cycling activities while weekday cycling remained relatively stable, albeit with fluctuations during lockdowns. There was a noticeable shift in weekday cycling away from central London, indicating potential displacement effects. Understanding these historical trends and pandemic impacts is crucial for informed policymaking in the transportation sector.

Download Presentation

Please find below an Image/Link to download the presentation.
The content on the website is provided AS IS for your information and personal use only. It may not be sold, licensed, or shared on other websites without obtaining consent from the author. Download presentation by click this link. If you encounter any issues during the download, it is possible that the publisher has removed the file from their server.
E N D
Presentation Transcript
1 Historical trends
2 Cycling has doubled in the last 20 years Significant growth in 2000-2015, partly driven by a shift towards sustainable travel in the public agenda and a subsequent boost in investment, especially since 2010. Cycling levels have been stable since, but this has also been seen in the growth rate of population and of travel demand in general. Cycling is still a minor mode in relative terms. Trip-based mode share was 1.2% in 2000; 2.0% in 2010 and 2.4% in 2019. AADF: DfT Average Annual Daily Flow data (mix of counts & estimates) TiL: Daily journey stages estimates based on LTDS data Note: All growth numbers in these slides refer to growth in cycle trips, or the overall amount of cycling on the network. Growth quoted in relation to schemes is often significantly higher but is not comparable because it includes rerouting of existing trips as well as mode shift.
3 The recent growth has been consistent across London Similar trends to London-wide data Possible indications of recent levelling-off of cycling levels Longer history of data reveals different trends in inner and outer London pre-2000, with outer London cycling decreasing and inner London cycling remaining flat, before both start to grow together in 2000 Cordons and screenlines are based on one day manual counts, making them subject to day to day weather related variations in cycling demand
4 Cycling during the pandemic
5 Weekend cycling has boomed during the pandemic while weekday cycling has been fairly steady outside the lockdowns 270% Weekday cycling fell by ~60% in the first lockdown, mostly recovered for the rest of 2020 and fell again by ~50% in the latest lockdown. Changes in weekend cycling were very variable, centred around twice normal levels. Total week cycling has thus stayed level or slightly above the previous year. Change from equivalent week the previous year Weekday Weekend Total 240% 21 0% 1 80% 1 50% 1 20% 90% 60% 30% 0% -30% -60% Changes are vs the same week the previous year, so they do not necessarily represent an absolute change compared to other weeks of this year. This data is based on 27 counters mostly in central London. Week ending
6 Weekday cycling has moved away from central London Weekday cycle flows in autumn 2020 increased by 7% in inner London and 22% in outer London, compared to spring 2019*. This does not necessarily represent an increase in the number of people cycling, since changes in the individual cycle frequency and the redistribution of existing flows also come into play, both of which have been seen strongly during the pandemic. In fact, weekday cycling flows from summer 2020 showed a 24% reduction in central London (Congestion Charge zone) compared to the previous year. This suggests that part of the increase in weekday cycle flows in inner and outer London could be displacement from cycling to or within central London. * Counts would normally take place in the same season (spring) but the first national lockdown forced the inner and outer counts to be postponed. The results may therefore be affected by seasonality, but this would be a conservative estimate. The panel of sites used in 2020 was a subset (of about 65%) of usual, but still representative of those areas. The results provided are like-for-like comparisons and take this difference in the panels into account.
7 Further evidence suggest a temporal redistribution of cycling demand away from the peaks The weekday morning and evening peaks have reduced while inter-peak cycling has grown. Weekends retain a single peak but this is larger in absolute and relative terms.