Expander Families and Ramanujan Graphs
An introduction to expander families and Ramanujan graphs by Tony Shaheen from CSU Los Angeles. The discussion covers the concept of regular graphs, motivation behind expander families, communication networks, and the goal of creating an infinite sequence of d-regular graphs optimized for communicat
1 views • 54 slides

Product and Knowledge Graphs for Enhanced Information Retrieval
Dive into the world of product and knowledge graphs, uncovering the journey to a rich product graph, examples of knowledge graphs for songs, and the mission to provide comprehensive information on products and related knowledge. Discover use cases ranging from information provision to enhancing sear
3 views • 76 slides

Exploring Various Types of Graphs in Statistics Education
Delve into the world of data visualization with slow reveal graphs, column graphs, pictographs, dot plots, divided bar graphs, sector graphs, line graphs, and stem-and-leaf plots. Engage in observations and wonderings to enhance statistical comprehension and analytical skills.
2 views • 8 slides

Graphs: An Introduction to Data Visualization
This chapter delves into various types of graphs used in data representation, such as bar graphs, pie graphs, histograms, line graphs, and linear graphs. It explains the purpose and structure of each graph type, along with practical examples. Additionally, it covers the Cartesian system for locating
1 views • 15 slides
Bar Graphs, Double Bar Graphs, and Histograms
Bar graphs are useful for displaying and comparing data, while double bar graphs help compare two related datasets. Histograms show the distribution of data. Learn how to interpret and create these visual representations effectively with examples provided.
0 views • 20 slides

Primal-Dual Algorithms for Node-Weighted Network Design in Planar Graphs
This research explores primal-dual algorithms for node-weighted network design in planar graphs, focusing on feedback vertex set problems, flavors and toppings of FVS, FVS in general graphs, and FVS in planar graphs. The study delves into NP-hard problems, approximation algorithms, and previous rela
2 views • 17 slides
Graphs of Straight Lines and Equations
Learn how to graph equations and find equations from graphs of straight lines. Explore tables of values, plotting points on a coordinate plane, drawing lines through points, and identifying relationships between graphs and algebraic expressions. Discover the gradient-intercept form of a straight lin
0 views • 14 slides
Speed vs. Time Graphs: Analyzing Acceleration and Motion
Explore the concept of speed vs. time graphs and learn how to recognize acceleration, interpret speed, analyze motion, and calculate acceleration from the slope of the graph. Discover the characteristics of graphs showing constant acceleration, varying acceleration, and deceleration. Engage in drawi
1 views • 19 slides

Representation of Abstract Groups through Graphs
Explore the representation of abstract groups as automorphism groups of graphs, touching on topics such as the existence of graphs whose automorphism groups are isomorphic to given abstract groups, the cardinality of connected graphs satisfying specific properties, and questions regarding the cardin
0 views • 16 slides
Low Threshold Rank Graphs and Their Structural Properties
Explore the intriguing world of low threshold rank graphs and their structural properties, including spectral graph theory, Cheeger's inequality, and generalizations to higher eigenvalues. Learn about the concept of threshold rank, partitioning of graphs, diameter limits, and eigenvectors approximat
0 views • 22 slides

Exploring Types of Graphs for Data Representation
Different types of graphs, such as line graphs, scatter plots, histograms, box plots, bar graphs, and pie charts, offer diverse ways to represent data effectively. Understanding when to use each type based on the data being collected is essential for insightful analysis. Scatter plots are ideal for
3 views • 37 slides

Relationships Through Graphs
Learn how to analyze and relate two quantities using graphs, analyze data presented in tables and graphs, and sketch graphs representing various scenarios such as the movement of a model rocket or a playground swing. The visuals provided will help you understand how to interpret and draw graphs in d
3 views • 7 slides
Advancements in Stream Processing with Augmented Sketch Technology
Augmented Sketch is a cutting-edge technology developed by Pratanu Roy, Arijit Khan, and Gustavo Alonso at ETH Zurich and Nanyang Technical University. This technology enables faster and more accurate processing of data streams, including IP traffic, phone calls, sensor measurements, and web interac
0 views • 21 slides
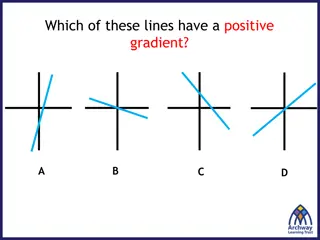
Correlation in Scatter Graphs
In this content, various graphs are used to demonstrate the concept of correlation in scatter graphs. It discusses positive, negative, and no correlation, showcasing how one variable affects the other. Examples and explanations are provided to help understand the relationships between different sets
0 views • 17 slides

Symmetric Chromatic Function for Voltage Graphs
Exploring the concept of a Symmetric Chromatic Function (SCF) for voltage graphs involves proper coloring conditions for edges and vertices, edge polarization functions, and decomposing voltage graphs into disconnected and connected squiggly graphs. The SCF allows for determining the number of ways
0 views • 7 slides

Uniquely Bipancyclic Graphs by Zach Walsh
Research conducted at the University of West Georgia focused on uniquely bipancyclic graphs, defined as bipartite graphs with exactly one cycle of specific lengths determined by the order. Uniquely bipancyclic graphs have special properties, including having a Hamiltonian cycle and a specific order
1 views • 18 slides
Sketch Resource Allocation for Software-defined Measurement in Network Management
Measurement plays a crucial role in network management, especially for tasks like heavy hitter detection and anomaly detection. The focus is on sketch-based measurement, using innovative techniques like Count-Min Sketch to approximate specific queries efficiently. Challenges include limited resource
1 views • 31 slides
LD-Sketch: Distributed Sketching Design for Anomaly Detection in Network Data Streams
LD-Sketch is a novel distributed sketching design for accurate and scalable anomaly detection in network data streams, addressing challenges such as tracking heavy keys in real-time across a vast key space. By combining high accuracy, speed, and low space complexity, LD-Sketch enables efficient heav
0 views • 25 slides

Graphs for Mathematical Interpretation
Explore how students can grasp information through graphical formats and convert it into mathematical graphs. Learn about qualitative graphs, functions, axes, and more. Delve into exercises matching graphs with situations and drawing graphs for given scenarios like plane take-off, biking, and snowbo
0 views • 16 slides

Adjacency Labeling Schemes and Induced-Universal Graphs
Adjacency labeling schemes involve assigning L-bit labels to vertices in a graph for efficient edge determination. The concept of induced-universal graphs is explored, where a graph is universal for a family F if all graphs in F are subgraphs of it. Theorems and lower bounds related to adjacency lab
0 views • 24 slides
Kinematics Graphs in Physics
Explore the concepts of kinematics graphs through diagrams and descriptions. Learn to interpret distance-time, velocity-time, and speed-time graphs. Understand key parameters such as displacement, initial velocity, final velocity, constant acceleration, and time spent on different parts of a journey
1 views • 33 slides
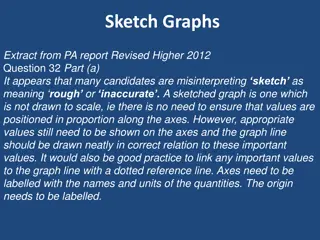
Guidelines for Sketch Graphs in Higher Level Exams
A sketch graph in assessments like the PA report Revised Higher 2012 should not be rough or inaccurate but neat and correctly representing important values. Axes should be labeled with names and units, the origin should be marked, and important values linked with a dotted line. The graph line should
0 views • 15 slides

Step-by-Step Guide: Drawing a Field Sketch at RSPB Pulborough Brooks
Create a field sketch at RSPB Pulborough Brooks following simple instructions provided by Jackie Day, the RSPB Education officer. Dividing the page, drawing the horizon, middle ground, and nearest land, adding details, and labeling elements like cattle grazing and ponds result in a beautiful field s
1 views • 9 slides
SHREC19 Track: Extended 2D Scene Sketch-Based 3D Scene Retrieval Overview
The SHREC19 Track focuses on Extended 2D Scene Sketch-Based 3D Scene Retrieval, aiming to retrieve relevant 3D scene models using scene sketches as input. This challenging research direction addresses the semantic gap between 2D sketches and accurate 3D scene models, with vast applications in 3D sce
0 views • 29 slides
Sketchovsky: Enabling Sketch Ensembles on Programmable Switches
Network measurement plays a crucial role in management tasks such as port scan detection and resource provisioning. The concept of sketch ensembles on programmable switches shows promise in addressing key challenges related to control and data plane operations. This approach offers a way to efficien
3 views • 20 slides
Contextual GAN for Image Generation from Sketch Constraint
Utilizing contextual GAN, this project aims to automatically generate photographic images from hand-sketched objects. It addresses the challenge of aligning output with free-hand sketches while offering advantages like a unified network for sketch-image understanding. The process involves posing ima
0 views • 21 slides
Graphs and Their Models
Explore the world of graphs through definitions, types, and special features. Learn about vertices, edges, simple and multiple graphs, directed and undirected graphs, and more. Discover the terminology and special types of graphs along with basic concepts and properties.
0 views • 33 slides
Introduction to Graph Theory: Exploring Graphs and Their Properties
This content delves into the realm of graph theory, focusing on the fundamental concepts and applications of graphs. It covers topics such as the Seven Bridges of Königsberg problem, types of graphs, vertex degrees, degree sequences, handshaking theorem, and more. Through visual aids and explanatio
0 views • 71 slides
Directed Graphs and Adjacency Matrices in Discrete Structures
Explore the concepts of binary relations, directed graphs, adjacency matrices, transitive closure, and walks in the context of discrete structures. Learn how vertices, edges, in-degrees, out-degrees, and self-loops are defined in directed graphs. Understand the importance of adjacency matrices in re
1 views • 28 slides
Graphs in Mathematics and Computer Science
Graphs in mathematics and computer science are abstract data types used to represent relationships between objects. They consist of vertices connected by edges, which can be directed or undirected. Graphs find applications in various fields like electric circuits, networks, and transportation system
0 views • 19 slides

Graphs in Discrete Mathematics
Graphs are fundamental objects in discrete mathematics that model relationships between pairs of objects. This overview covers the vocabulary, formal definitions, and types of graphs, including directed and undirected graphs. Learn about vertices, edges, adjacency, and more essential concepts in gra
0 views • 18 slides
Overview Graph Coverage Criteria
Software testing involves various techniques such as graph coverage criteria and test paths. This overview delves into the hierarchy of structural graph coverages, covering graphs, the definition of a graph, example graphs, paths in graphs, and test paths in SESE graphs.
0 views • 33 slides

Graph Theory in Mathematics Curriculum
Integrate graphs and networks into math curriculum to engage students with practical applications. Explore simple graphs, directed graphs, bipartite graphs, matching problems, and planar graphs across different year levels. Enhance understanding of concepts like complete graphs, vertices, edges, and
0 views • 43 slides
Transformations of graphs
The transformations of graphs including translations, reflections, and stretches. Understand the impact of constant terms on the graphs and learn to sketch transformed functions using your graphing calculator.
0 views • 21 slides
Graphs and Trees: Understanding Relationships in Graph Theory
In the world of graph theory, graphs and trees play a significant role in describing relationships among items in a collection. Graphs consist of vertices representing intersections or stations, connected by edges like roadways or friendships. Trees, on the other hand, are minimally connected graphs
0 views • 30 slides

Property Testing in Graphs using Arbitrary Models
This content discusses the standard models of property testing in graphs and proposes more realistic approaches involving arbitrary vertex sets and distributions. It explores sublinear time approximate decision-making based on oracle access to graphs and distances between graphs.
0 views • 10 slides

Understanding Exponential Random Graphs in Network Structures
Explore the concept of exponential random graphs and their application in analyzing different network structures. Learn about ensemble models of networks, defining probabilities for graphs, maximizing entropy, and the partition function in graph theory. Gain insights into the possibilities and const
0 views • 42 slides

Understanding Fan-Planar Graphs: Simplifying Techniques and Algorithms
Explore the concept of fan-planar graphs and learn about simplifying non-simple fan-planar drawings using elementary methods. Discover how to recognize fan-planar graphs and the differences between simple and non-simple fan-planarity. Dive into algorithms for simplifying and recognizing fan-planar g
1 views • 18 slides

Understanding Graph Theory: Vertices, Edges, and Planar Graphs
Explore the world of graphs in graph theory, including concepts like vertices, edges, planar graphs, and Euler's theorem. Learn about dual graphs, planarity testing, and the smallest not-planar graphs K5 and K3,3. Dive into the fascinating realm of graph drawing and visualization.
0 views • 32 slides

Real-Time Exemplar-Based Face Sketch Synthesis Pipeline
Learn about a real-time exemplar-based face sketch synthesis pipeline that utilizes photo-sketch pairs and advanced algorithms for sketch denoising, including Coarse Sketch Generation and Proposed Spatial Sketch Denoising Algorithm (SSD).
0 views • 9 slides