Expander Families and Ramanujan Graphs
An introduction to expander families and Ramanujan graphs by Tony Shaheen from CSU Los Angeles. The discussion covers the concept of regular graphs, motivation behind expander families, communication networks, and the goal of creating an infinite sequence of d-regular graphs optimized for communicat
1 views • 54 slides

Product and Knowledge Graphs for Enhanced Information Retrieval
Dive into the world of product and knowledge graphs, uncovering the journey to a rich product graph, examples of knowledge graphs for songs, and the mission to provide comprehensive information on products and related knowledge. Discover use cases ranging from information provision to enhancing sear
3 views • 76 slides
Physics Clicker Questions and Graphs
Explore a set of physics clicker questions and accompanying graphs covering topics such as ball motion, light refraction, Moon phases, velocity graphs, and integration methods. Test your knowledge and understanding of physics concepts with these engaging questions.
3 views • 17 slides

Exploring Various Types of Graphs in Statistics Education
Delve into the world of data visualization with slow reveal graphs, column graphs, pictographs, dot plots, divided bar graphs, sector graphs, line graphs, and stem-and-leaf plots. Engage in observations and wonderings to enhance statistical comprehension and analytical skills.
1 views • 8 slides

National 5 Applications of Maths: Charts, Graphs, and Tables Examples
Explore various examples related to reading bar charts, line graphs, stem-and-leaf diagrams, pie charts, and constructing stem-and-leaf charts in the context of National 5 Applications of Maths. Practice interpreting data from tables, line graphs, and stem-and-leaf diagrams to enhance your understan
1 views • 18 slides

Graphs: An Introduction to Data Visualization
This chapter delves into various types of graphs used in data representation, such as bar graphs, pie graphs, histograms, line graphs, and linear graphs. It explains the purpose and structure of each graph type, along with practical examples. Additionally, it covers the Cartesian system for locating
0 views • 15 slides
Bar Graphs, Double Bar Graphs, and Histograms
Bar graphs are useful for displaying and comparing data, while double bar graphs help compare two related datasets. Histograms show the distribution of data. Learn how to interpret and create these visual representations effectively with examples provided.
0 views • 20 slides

Primal-Dual Algorithms for Node-Weighted Network Design in Planar Graphs
This research explores primal-dual algorithms for node-weighted network design in planar graphs, focusing on feedback vertex set problems, flavors and toppings of FVS, FVS in general graphs, and FVS in planar graphs. The study delves into NP-hard problems, approximation algorithms, and previous rela
0 views • 17 slides
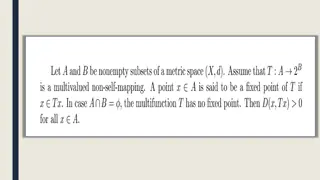
Mathematical Definitions and Theorems Illustrated
In this collection of images, various mathematical concepts are visually presented, including definitions, theorems, and proofs. The slides cover a range of topics in a structured manner, providing a concise overview of key mathematical principles. From foundational definitions to detailed proofs, t
0 views • 12 slides
Graphs of Straight Lines and Equations
Learn how to graph equations and find equations from graphs of straight lines. Explore tables of values, plotting points on a coordinate plane, drawing lines through points, and identifying relationships between graphs and algebraic expressions. Discover the gradient-intercept form of a straight lin
0 views • 14 slides

Mathematical Modeling and Error Analysis in Engineering
Mathematical modeling plays a crucial role in solving engineering problems efficiently. Numerical methods are powerful tools essential for problem-solving and learning. This chapter explores the importance of studying numerical methods, the concept of mathematical modeling, and the evaluation proces
0 views • 10 slides
Speed vs. Time Graphs: Analyzing Acceleration and Motion
Explore the concept of speed vs. time graphs and learn how to recognize acceleration, interpret speed, analyze motion, and calculate acceleration from the slope of the graph. Discover the characteristics of graphs showing constant acceleration, varying acceleration, and deceleration. Engage in drawi
0 views • 19 slides
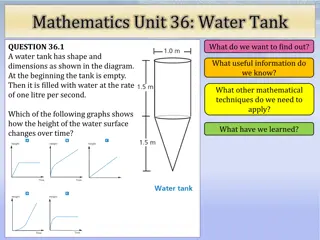
Water Tank Dynamics Through Mathematical Analysis
Explore the dynamics of a water tank being filled at a rate of one litre per second and analyze how the height of the water surface changes over time. Learn about the useful information available, the mathematical techniques required, and examine graphs depicting the changing water levels. Gain insi
0 views • 5 slides
Semantic Analysis of Clinical Narratives Using Complex Knowledge Graphs
Need for improved semantic analysis of clinical narratives for information retrieval and decision support is addressed through the use of complex knowledge graphs. These graphs capture axiomatic descriptions of generalizable truths about entities in the medical domain, providing a language-independe
0 views • 8 slides

Mathematical Modeling and Error Analysis in Engineering
Mathematical modeling plays a crucial role in problem-solving in engineering by using numerical methods. This involves formulating problems for solutions through arithmetic operations. The study of numerical methods is essential as they are powerful problem-solving tools that enhance computer usage
5 views • 10 slides
Line Graphs: Year 6 Lesson Overview
This document provides an introduction to interpreting line graphs for Year 6 students. It covers key concepts, reviews essential skills, explores precise mathematical vocabulary, and includes lesson clips on right angles and perpendicular lines. The journey through the lesson involves a focus on pe
0 views • 26 slides

Representation of Abstract Groups through Graphs
Explore the representation of abstract groups as automorphism groups of graphs, touching on topics such as the existence of graphs whose automorphism groups are isomorphic to given abstract groups, the cardinality of connected graphs satisfying specific properties, and questions regarding the cardin
0 views • 16 slides
Low Threshold Rank Graphs and Their Structural Properties
Explore the intriguing world of low threshold rank graphs and their structural properties, including spectral graph theory, Cheeger's inequality, and generalizations to higher eigenvalues. Learn about the concept of threshold rank, partitioning of graphs, diameter limits, and eigenvectors approximat
0 views • 22 slides

Exploring Types of Graphs for Data Representation
Different types of graphs, such as line graphs, scatter plots, histograms, box plots, bar graphs, and pie charts, offer diverse ways to represent data effectively. Understanding when to use each type based on the data being collected is essential for insightful analysis. Scatter plots are ideal for
3 views • 37 slides

Relationships Through Graphs
Learn how to analyze and relate two quantities using graphs, analyze data presented in tables and graphs, and sketch graphs representing various scenarios such as the movement of a model rocket or a playground swing. The visuals provided will help you understand how to interpret and draw graphs in d
2 views • 7 slides
FlashGraph: Processing Billion-Node Graphs on Commodity SSDs
FlashGraph proposes a system that combines SSDs and RAM for efficient graph processing, storing vertices in memory and edge lists in SSD storage. The system can handle large graphs without using excessive memory and boasts performance comparable to in-memory graph processing engines. While SSDs offe
0 views • 6 slides
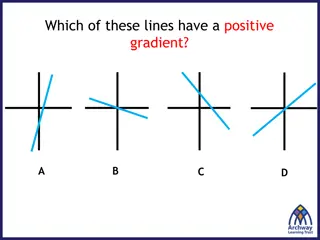
Correlation in Scatter Graphs
In this content, various graphs are used to demonstrate the concept of correlation in scatter graphs. It discusses positive, negative, and no correlation, showcasing how one variable affects the other. Examples and explanations are provided to help understand the relationships between different sets
0 views • 17 slides

Symmetric Chromatic Function for Voltage Graphs
Exploring the concept of a Symmetric Chromatic Function (SCF) for voltage graphs involves proper coloring conditions for edges and vertices, edge polarization functions, and decomposing voltage graphs into disconnected and connected squiggly graphs. The SCF allows for determining the number of ways
0 views • 7 slides

Uniquely Bipancyclic Graphs by Zach Walsh
Research conducted at the University of West Georgia focused on uniquely bipancyclic graphs, defined as bipartite graphs with exactly one cycle of specific lengths determined by the order. Uniquely bipancyclic graphs have special properties, including having a Hamiltonian cycle and a specific order
0 views • 18 slides

Graphs for Mathematical Interpretation
Explore how students can grasp information through graphical formats and convert it into mathematical graphs. Learn about qualitative graphs, functions, axes, and more. Delve into exercises matching graphs with situations and drawing graphs for given scenarios like plane take-off, biking, and snowbo
0 views • 16 slides
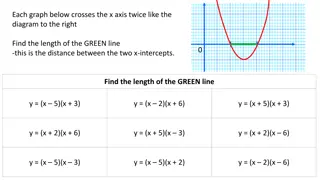
Mathematical Problems Involving Graphs and Equations
The content includes a set of mathematical problems related to graphs, equations, and modeling of paths using given equations. These problems involve finding distances, heights, and intersection points based on the provided graph representations. The scenarios involve water sprinklers watering lawns
0 views • 6 slides
Checking Mathematical Proofs
Reading and understanding mathematical proofs involves careful analysis of logic and reasoning. Mathematicians and students use various strategies to ensure correctness, such as examining assumptions, following step-by-step logic, and verifying conclusions. This process is crucial for grasping the v
1 views • 79 slides
Metamath: A Computer Language for Mathematical Proofs
Metamath is a computer language designed for representing mathematical proofs. With several verifiers and proof assistants, it aims to formalize modern mathematics using a simple foundation. The Metamath-100 project is focused on proving a list of 100 theorems, with significant progress made in prov
0 views • 17 slides

Adjacency Labeling Schemes and Induced-Universal Graphs
Adjacency labeling schemes involve assigning L-bit labels to vertices in a graph for efficient edge determination. The concept of induced-universal graphs is explored, where a graph is universal for a family F if all graphs in F are subgraphs of it. Theorems and lower bounds related to adjacency lab
0 views • 24 slides
Kinematics Graphs in Physics
Explore the concepts of kinematics graphs through diagrams and descriptions. Learn to interpret distance-time, velocity-time, and speed-time graphs. Understand key parameters such as displacement, initial velocity, final velocity, constant acceleration, and time spent on different parts of a journey
0 views • 33 slides
Mathematics Program Quality Improvement Report 2009-2010 at Department of Mathematical Sciences
This report outlines the student-learning outcomes of the Mathematics program at the Department of Mathematical Sciences. It covers areas such as knowledge of mathematical content, reasoning and proof, mathematical representation and problem-solving, mathematical communication, and knowledge of tech
0 views • 29 slides

Enhancing Critical Thinking Skills Through Mathematical Concepts in Mrs. Helenski's Classroom
Mrs. Helenski's classroom provides a safe environment where mathematical concepts are utilized to develop critical thinking skills for both mathematical knowledge and everyday life. With a focus on promoting metacognition in Geometry Honors, students are challenged to apply, prove, justify, and expl
0 views • 20 slides
Mathematical Literacy and Its Importance in Education
Recognizing the language of mathematics, understanding symbols, and being able to explain solutions are key components of mathematical literacy. It goes beyond merely answering questions correctly to encompass explaining reasoning and exploring concepts actively. The Standards for Mathematical Pract
0 views • 36 slides
Graphs and Their Models
Explore the world of graphs through definitions, types, and special features. Learn about vertices, edges, simple and multiple graphs, directed and undirected graphs, and more. Discover the terminology and special types of graphs along with basic concepts and properties.
0 views • 33 slides
Introduction to Graph Theory: Exploring Graphs and Their Properties
This content delves into the realm of graph theory, focusing on the fundamental concepts and applications of graphs. It covers topics such as the Seven Bridges of Königsberg problem, types of graphs, vertex degrees, degree sequences, handshaking theorem, and more. Through visual aids and explanatio
0 views • 71 slides
Directed Graphs and Adjacency Matrices in Discrete Structures
Explore the concepts of binary relations, directed graphs, adjacency matrices, transitive closure, and walks in the context of discrete structures. Learn how vertices, edges, in-degrees, out-degrees, and self-loops are defined in directed graphs. Understand the importance of adjacency matrices in re
1 views • 28 slides
Graphs in Mathematics and Computer Science
Graphs in mathematics and computer science are abstract data types used to represent relationships between objects. They consist of vertices connected by edges, which can be directed or undirected. Graphs find applications in various fields like electric circuits, networks, and transportation system
0 views • 19 slides

Graphs in Discrete Mathematics
Graphs are fundamental objects in discrete mathematics that model relationships between pairs of objects. This overview covers the vocabulary, formal definitions, and types of graphs, including directed and undirected graphs. Learn about vertices, edges, adjacency, and more essential concepts in gra
0 views • 18 slides
Innovative Approach in Mathematical Education for Maritime Students
Explore the innovative approach in mathematical education for maritime students as presented during the MareMathics Teachers Training and Meeting in Tallinn. The sessions covered topics such as mathematical applications in thermodynamics, including partial derivatives, derivations, and integrals wit
0 views • 11 slides

Mathematical Proofs and Concepts
Explore the world of mathematical proofs through chapters 4, 5, and 6. Delve into terminology, theorems, definitions, divisors, and accepted axioms used in mathematical reasoning. Discover the logic behind proofs and various methods employed in establishing the truth of mathematical statements.
2 views • 101 slides