Bivariate Normal Data Analysis: LPGA 2008 Season Overview
Explore the analysis of bivariate normal data focusing on LPGA driving distance and fairway percent from the 2008 season. Learn how to compute confidence ellipses, estimated means, variance-covariance matrix, eigenvalues, eigenvectors, and plot insightful visualizations. Understand the method, set u
1 views • 8 slides
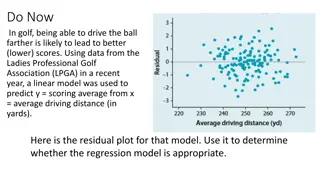
Analyzing Residual Plots for Regression Model Appropriateness in Golf
Utilizing residual plots to evaluate the appropriateness of a linear regression model predicting scoring average from average driving distance in golf based on LPGA data. Introduction to quadratic and exponential models, with an example exploring the relationship between braking distance for motorcy
0 views • 15 slides
Building Regression Model for LPGA Golf Performance - 2008
The regression model for LPGA Golf Performance in 2008 focuses on predicting prize winnings per round based on various golf performance metrics. The process includes data description, modeling strategies, selecting predictors, training the model, and assessing its validity. The analysis involves inf
0 views • 14 slides
Analysis of Quantile Regression on LPGA Prize Winnings for 2009/2010 Seasons
This analysis focuses on using Quantile Regression to study professional female golfers' prize earnings in the Ladies Professional Golf Association (LPGA) during the 2009 and 2010 seasons. The study investigates how various factors like average driving distance, fairway accuracy, greens in regulatio
2 views • 11 slides

Master Your Swing at Americas Golf Schools
America's Golf Schools, one of the top Golf Academies in the USA, offers comprehensive programs for all skill levels. From beginner essentials to advanced player development, our PGA and LPGA-certified instructors provide personalized coaching using
4 views • 8 slides