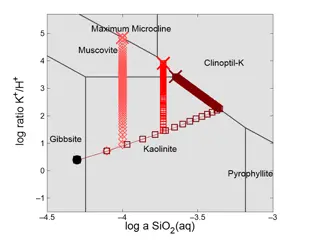
Understanding Reaction Path Traces in GWB12
Visualizing reaction path traces in GWB12 using Act2 or Tact diagrams helps in analyzing how mineral stability and fluid chemistry evolve during reactions like K-feldspar titration. By overlaying multiple traces, customizing markers and lines, users can explore the impact of different silica polymor
0 views • 6 slides
