Intensive Course on Organization Structure and Management Principles
Delve into the intricacies of organization structures and management principles through an intensive course led by Prof. Takao Ito, focusing on topics such as evolution of management, cost analysis, leadership, and more. Understand different organizational structure types and their characteristics for a well-rounded learning experience.
- Organization Structure
- Management Principles
- Intensive Course
- Professor Takao Ito
- Business Education
Download Presentation

Please find below an Image/Link to download the presentation.
The content on the website is provided AS IS for your information and personal use only. It may not be sold, licensed, or shared on other websites without obtaining consent from the author. Download presentation by click this link. If you encounter any issues during the download, it is possible that the publisher has removed the file from their server.
E N D
Presentation Transcript
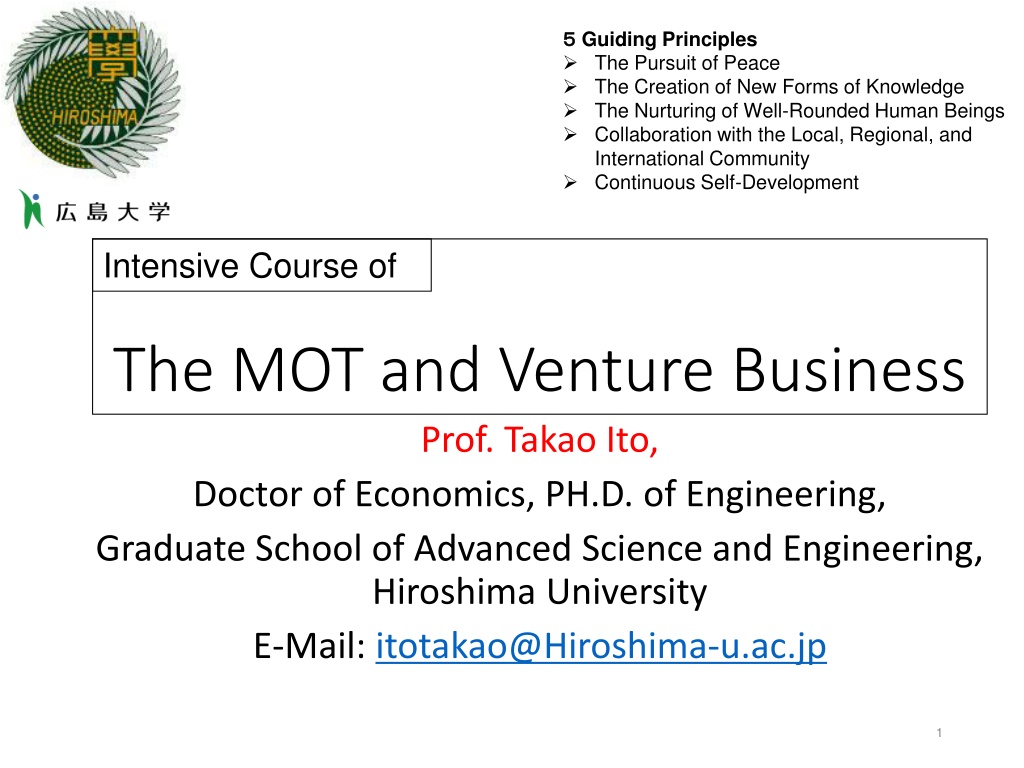
Guiding Principles The Pursuit of Peace The Creation of New Forms of Knowledge The Nurturing of Well-Rounded Human Beings Collaboration with the Local, Regional, and International Community Continuous Self-Development Intensive Course of The MOT and Venture Business Prof. Takao Ito, Doctor of Economics, PH.D. of Engineering, Graduate School of Advanced Science and Engineering, Hiroshima University E-Mail: itotakao@Hiroshima-u.ac.jp 1
Schedule MOT and Venture Business (An Intensive Course) 08:50-16:20, Saturday and Sunday No. Date 1 2023/10/21Sat Outlines and Introduction 2 2023/10/21Sat The evolution of Management 3 2023/10/21Sat Key Issues in Corporate Management 4 2023/10/21Sat Break-Even Point Analysis 5 2023/10/22Sun Cost Benefit Analysis and Ethics 6 2023/10/22Sun Stock Control 7 2023/10/22Sun Case Studies and Group Discussion 8 2023/10/22Sun Kaizen and Quality Control 9 2023/11/11Sat Motivation (self Learning) 10 2023/11/11Sat Organization Structure 11 2023/11/11Sat Decision-making and Strategy 12 2023/11/11Sat Leadership 13 2023/11/12Sun Business Plan 14 2023/11/12Sun Entrepreneur and Venture Business 15 2023/11/12Sun Presentation and/or Final Examination 16 2023/11/12Sun Review and Free Discussion Lecture 08:50-10:20 10:30-12:00 13:10-14:40 14:50-16:20 08:50-10:20 10:30-12:00 13:10-14:40 14:50-16:20 08:50-10:20 10:30-12:00 13:10-14:40 14:50-16:20 08:50-10:20 10:30-12:00 13:10-14:40 14:50-16:20 2
Agenda 1. Organization Structures 2. Network Organization 4
1. Organization Structures The plan for the systematic arrangement of work is the organization structure The formalized organizational chart has been around since 1854, when Daniel McCallum became general superintendent of the New York and Erie Railroad one of the world's longest railroads.
Organizational structure types Pre-bureaucratic structures Bureaucratic structures Post-bureaucratic Functional structures Divisional structures Traditional structures Modern structures Other characteristics
Bureaucratic organizations Pre-bureaucratic structures Lack standardization of tasks Bureaucratic structures It has certain degree of standardization. Post-bureaucratic Generic: total quality management, culture management, and matrix management Specific: based on dialogue and consensus rather than authority and command.
Traditional structures Line structures chain of command Line-and-staff structures line structure with the staff departments that service, advice, and support them. Functional structures functional divisions of different specialized set of tasks
Other structures Divisional structures Matrix structures Flat structures Team Network Boundary-less structures Virtual organizations
Main characteristics Centralization Decentralization Departmentalization
Centralization vs. Decentralization Centralization Decentralization Scale Small Large Brain workers (White-collar workers) Physical workers (Blue-collar workers) Workers Geographic condition Concentration Dispersion Styles of the leader Strong Weak
Success factors Decentralized reporting Flat hierarchy High transient speed High transparency Permanent monitoring Rapid response Shared reliability Matrix hierarchy
2. Network Organization Internet : Computer and Network Internet of things : Network of things using computer technology Network : Social Network, Information Exchange Network, Computer Network, Human-being network, etc.
Computer Network = Information Processing + Communication Human-Being Network : Friendship Network, Workflow Network, Information Exchange Network, etc.
Background The History of Network Research : in the 1930s, group of German Emigres: cognitive ad social psychology sociometry and group dynamics. In the 1950s, the concept of networks: anthropology, psychology, sociology, mental health, and molecular biology.
Background The beginning of Internet : in the 1950s and developed in the 1980s. Why we use internet = use it as a tool to attain our goal in an effective and efficient manner through planning, organizing, leading and controlling our resources.
Background Strong ties and weak ties = qualitative description and Granovetter dilemma Small World Problem : to contact any two people only takes an average of five people. Six Degrees of Separation
Six Degrees of Separation Mr. A: 44 friends Mr. 1, one of the friends of Mr. A: 44 friends ( No overlap with Mr. A) Mr. 2, one of the friends of Mr. 1: 44 friends ( No overlap with Mr. A and Mr. 1) Total number of Mr. A within 6 degrees of separation = 446 , 7 256 313 , 856 , 7 billion Total population in the world 19
Measurement of Network To measure the network structure Structure indices : Centrality (Degree, Betweenness, Closeness, etc.), Capacity, Influence, Density, Effective Size, Balance, Block, Clique, Efficiency, etc.
Network and its Application Keiretsu = a system of organizations with integrated and interlocking business relationships and joint shareholdings Panasonic = A group company Accounting System = formation of accounting system under the impact of decision-maker s
Cross shareholdings relationship between car-maker Mazda and its Suppliers in 2004 22
Transaction relationship between car-maker Nisan and its Suppliers in 2004 23
Centrality: Degree n = i = ( ) ( , ) C p a p p D k i k 1 i k; a (pi, pk) = 1 if and only if piand pk are connected by a line a (pi, pk) = 0 otherwise
Centrality: Betweenness ( ) g p n n n n i i ij k = = ( ) ( ) C p b p B k ij k g j j ij i j k; gij: the number of geodesics linking piand pj gij(pk): the number of geodesics linking pi and pjthat contains pk
Centrality: Closeness n = i = 1 ( ) ( , ) C p d p p C K i k 1 i k; d (pi, pk): the number of edges in the geodesic linking piand pk
Demonstrate: Result No. Degree Betweenness Closeness 1 2 3 4 5 4 2 2 2 2 4 0 0 0 0 4 6 6 6 6
Demonstrate: Relative centrality Fig. B Fig. A
Centrality: Relative Degree n = ( , ) a p p i k ( ) C p = = ' 1 i D k ( ) C p D k 1 1 n n CD(pk) = Degree of node pk n = Number of the nodes
Centrality: Relative Betweenness 2 2 ( ) C p = ' B k ( ) C p B k + 3 2 n n CB(pk) = Betweenness of node pk n = Number of the nodes
Demonstrate denominator in CB(pK) Maximum of the possible connection lines between any two nodes : (n,2)=n(n-1)/2, maximum of the possible lines connected to node pk: n-1, then we get ) 1 + 2 ( 3 2 n n n n = ) 1 = min ( Deno ator n 2 2 32
Centrality: Relative Closeness 1 n i ( , ) d p p i k p 1 1 n n = ' 1 = = = ( ) C p c k 1 n 1 n ( ) C i c k ( , ) d p p i k = 1 CC(pk)-1 = Closeness of node pk n = Number of the nodes
Demonstrate centrality No. Relative Degree Relative Betweenness Fig. A 0.67 0 0 0 0 Relative Closeness Fig. A 1 0.67 0.75 0.67 0.75 0.67 0.6 0.67 Fig. A 1 0.5 0.67 0.5 0.67 0.5 0.33 0.5 Fig. B 1 Fig. B 2 0 0 0 Fig. B 1 1(A) 2(B) 3(C) 4(D) 5
Demonstrate entire centrality Fig. B Fig. A
Centrality: The Entire Degree n = [ ( *) ( )] C p C p D D i = 1 i C D + 2 3 2 n n CD(p*) = Maximum degree of node pi CD(pi) = Degree of node pi n = Number of the nodes
Demonstrate denominator in CD The entire centrality n = i * C [ ( ) ( )] p C p x x i = 1 C x n = i * max C [ ( ) ( )] p C p x x i 1 37
Demonstrate denominator in CD The question: how to determine the denominator in centrality Star or wheel : the biggest network 38
Demonstrate denominator in CD n = i * max [ ( ) ( )] C p C p D D i 1 = ) 1 ) 1 ( n )(( 1 n n = + 2 3 2 n 39
Demonstrate denominator in CD n = n * max [ ( ) ( )] C p C p D D i 1 i = ) 1 n + ) 1 ) 1 2 n (( ) 2 ( )(( 3 n n = 2 3 + 2 3 2 n n 40
Demonstrate denominator in CD n = n * max [ ( ) ( )] C p C p D D i 1 i = ) 0 + ) 2 ) 1 (( n ) 2 n ( 2 )(( n n = + 2 4 4 + 2 3 2 n n 41
Centrality: The Entire Betweenness n = i 2 [ ( *) ( ] ) i C p C p B B = 1 n C B + 3 2 4 5 2 n n CB(p*) = Maximum betweenness of node pi CD(pi) = Betweenness of node pi n = Number of the nodes
Demonstrate denominator in CB The entire betweenness should be calculated as follows. n B * i [ ' ( ) ' ( )] C p C p B i == 1 C B 1 n 43
Demonstrate denominator in CB * n 2 n ( ) 2 n ( n ) C p C p = i [ ] B i B + + 2 2 3 2 3 2 n = 1 C B 1 n n = i * 2 [ ( ) ( )] C p C p B B i = 1 n + 2 ( 1 )( 3 ) 2 n n n = i * 2 [ ( ) ( )] C p C p B B i = 1 n + 3 2 4 5 2 n n 44
Centrality: The Entire Closeness n 3 ( ) 2 3 n n = i = ' * ' ( ) ( ) C C p C p c c c i + 2 2 n 1 CC(p*) = Maximum closeness of node pi CD(pi) = Closeness of node pi n = Number of the nodes
Demonstrate denominator in CC The distance from central node to all other nodes : 1. The distance from certain node to the central node : 1, to all other nodes : 2 Then we get ( 2 1 + n 1 1 n n = ) 2 2 3 n 46
Demonstrate denominator in CC The gap between the central node to all other nodes 1 1 = n Then we get 2 n n 2 3 2 3 n 2 n + 2 3 2 n n n ) 1 = ( n 2 3 2 3 n 47
Demonstrate centrality The Entire Degree The Entire Betweenness The Entire Closeness Fig. A Fig. B Fig. A Fig. B Fig. A Fig. B 0.67 0.67 0.67 0.67 0.78 0.75
New network approaches Network Formation Theory = All of the nodes are decided by choice, but not by chance. Spatial Graph Theory = New approach using 3-Dimensional Spatial graph theory to identify structure
Thank you for your attention! Thank you for your attention!
