Understanding Ship Propulsion Power Estimation
In the process of ship design, it is crucial to estimate the power required for propulsion to determine machinery masses, fuel consumption, and tank capacities. Power estimates can be derived through comparisons with existing vessels or model tests, involving scaling laws for different components. Ship power predictions can be made through model experiments, standard series data usage, or theoretical approaches. Having an understanding of propulsion system performance characteristics is essential for accurate power estimation, considering the efficient conversion of power into thrust for propulsion. Various forms of main propulsion engines, such as Diesel, Gas turbine, Steam turbine, and Electric types, play a key role in ship propulsion.

Download Presentation

Please find below an Image/Link to download the presentation.
The content on the website is provided AS IS for your information and personal use only. It may not be sold, licensed, or shared on other websites without obtaining consent from the author. Download presentation by click this link. If you encounter any issues during the download, it is possible that the publisher has removed the file from their server.
E N D
Presentation Transcript
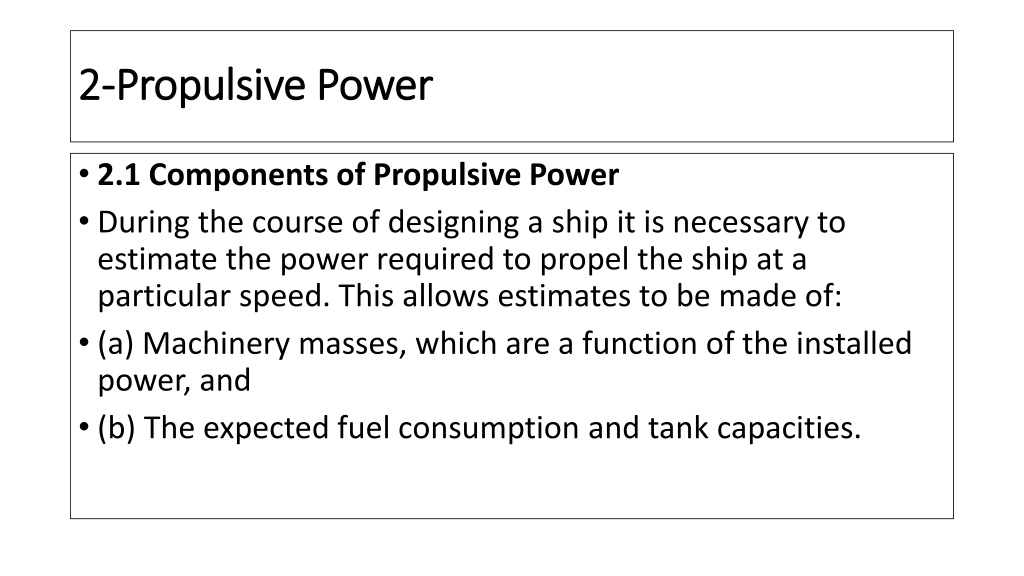
2 2- -Propulsive Power Propulsive Power 2.1 Components of Propulsive Power During the course of designing a ship it is necessary to estimate the power required to propel the ship at a particular speed. This allows estimates to be made of: (a) Machinery masses, which are a function of the installed power, and (b) The expected fuel consumption and tank capacities.
The power estimate for a new design is obtained by comparison with an existing similar vessel or from model tests. In either case it is necessary to derive a power estimate for one size of craft from the power requirement of a different size of craft. That is, it is necessary to be able to scale powering estimates. The different components of the powering problem scale in different ways and it is therefore necessary to estimate each component separately and apply the correct scaling laws to each.
One fundamental division in conventional powering methods is to distinguish between the effective power required to drive the ship and the power delivered to the propulsion unit(s). The power delivered to the propulsion unit exceeds the effective power by virtue of the efficiency of the propulsion unit being less than 100%.
Ship power predictions are made either by (1) Model experiments and extrapolation, or (2) Use of standard series data (hull resistance series and propeller series), or (3) Theoretical (e.g. components of resistance and propeller design). (4) A mixture of (1) and (2) or (1), (2) and (3).
Propulsion Systems Propulsion Systems When making power estimates it is necessary to have an understanding of the performance characteristics of the chosen propulsion system, as these determine the operation and overall efficiency of the propulsion unit.
A fundamental requirement of any ship propulsion system is the efficient conversion of the power (P) available from the main propulsion engine(s) [prime mover] into useful thrust (T) to propel the ship at the required speed (V), There are several forms of main propulsion engines including: Diesel. Gas turbine. Steam turbine. Electric. (And variants / combinations of these).
Various propulsors (generally variants of a propeller) which convert the power into useful thrust, including: Propeller, fixed pitch (FP). Propeller, controllable pitch (CP). Ducted propeller. Waterjet. Azimuthing podded units. (And variants of these).
Each type of propulsion engine and propulsor has its own advantages and disadvantages, and applications and limitations, including such fundamental attributes as size, cost and efficiency. All of the these propulsion options are in current use and the choice of a particular propulsion engine and propulsor will depend on the ship type and its design and operational requirements. Propulsors and propulsion machinery are described in Chapters 11 and 13.
Each type of propulsion engine and propulsor has its own advantages and disadvantages, and applications and limitations, including such fundamental attributes as size, cost and efficiency. All of the these propulsion options are in current use and the choice of a particular propulsion engine and propulsor will depend on the ship type and its design and operational requirements. Propulsors and propulsion machinery are described in Chapters 11 and 13.
The overall assessment of the marine propulsion system for a particular vessel will therefore require: (1) A knowledge of the required thrust (T) at a speed (V), and its conversion into required power (P), (2) A knowledge and assessment of the physical properties and efficiencies of the available propulsion engines, (3) The assessment of the various propulsors and engine-propulsor layouts.
Definitions Definitions .
The QPC depends primarily upon the efficiency of the propulsion device, but also depends on the interaction of the propulsion device and the hull. The required power margin for fouling and weather will depend on the areas of operation and likely sea conditions and will typically be between 15% and 30% of installed power
Components of the Ship Power Estimate Components of the Ship Power Estimate The total calm water resistance is made up of the hull naked resistance, together with the resistance of appendages and the air resistance. The propeller quasi-propulsive coefficient (QPC), or D, is made up of the open water 0, hull Hand relative rotative Refficiencies. The hull efficiency is derived as H=(1 t)/(1 wT), where t is the thrust deduction factor and wTis the wake fraction.
For clarity, the model-ship correlation allowance is included as a single-ship correlation factor, SCF, applied to the overall delivered power. Transmission losses, T, between the engine and tailshaft/propeller are typically about T= 0.98 for direct drive engines aft, and T= 0.95 for transmission via a gearbox. The margins in stage 9 account for the increase in resistance, hence power, due to roughness, fouling and weather. They are derived in a scientific manner for the purpose of installing propulsion machinery with an adequate reserve of power. The total installed power, PI, will typically relate to the MCR (maximum continuous rating) or CSR (continuous service rating) of the main propulsion engine, depending on the practice of the ship operator.
propeller detail D(m) = Ratio= main engine Pm(kW) = Nm(RPM)= Np(RPM)= 1750 4.000 7.200 1750 900 125 DUCTED PROPELLER N Vs Pe Pd Pbmin (kWs) 917 1079 1270 1494 1758 2069 Nmak (RPM) 768 811 855 900 948 998 H 0 r d wt t (knots) 10.0 10.5 11.0 11.5 12.0 12.5 Not: %100 MCR ve deniz marjini olmaks z n asgari makina g c Pbmin; htr = 0.965 (kWs) 585 688 809 950 1114 1307 (kWs) 885 1041 1226 1442 1696 1997 olarak hesaplanm t r. (RPM) 107 113 119 125 132 139 0.279 0.279 0.279 0.279 0.279 0.279 0.248 0.248 0.248 0.248 0.248 0.248 1.044 1.044 1.044 1.044 1.044 1.043 0.624 0.624 0.623 0.622 0.620 0.618 1.015 1.015 1.015 1.015 1.015 1.015 0.661 0.661 0.660 0.659 0.657 0.655 4000 3500 3000 Power [kW] 2500 2000 Pe 1500 Pbmin 1000 500 0 7.0 8.0 9.0 10.011.012.013.014.015.0 Speed [knots]
Application for determining the speed achieved under margins Engine Margin = 85% Sea Margin = %10 Shaft&RG Loss = %4.5 Shaft Generator SG - Ppto = 75 kW


")