Eliciting Weights for Human Development Index with Discrete Choice Experiment
A study conducted by Koen Decancq and Verity Watson in September 2020 explores the process of eliciting weights for the Human Development Index (HDI) using a discrete choice experiment. The research delves into the trade-offs individuals make between different dimensions of the HDI, providing insights on how to estimate these trade-offs effectively. The study utilizes a sample of approximately 1000 ECON students from four countries and discusses the implications of a super-generalized HDI approach. Various formulas and models are presented to showcase the methodology and results obtained through the research.
- Human Development Index
- Eliciting Weights
- Discrete Choice Experiment
- Trade-offs
- Super-Generalized HDI

Download Presentation

Please find below an Image/Link to download the presentation.
The content on the website is provided AS IS for your information and personal use only. It may not be sold, licensed, or shared on other websites without obtaining consent from the author. Download presentation by click this link. If you encounter any issues during the download, it is possible that the publisher has removed the file from their server.
E N D
Presentation Transcript
Eliciting weights for the Human Development Index with a discrete choice experiment Koen Decancq Verity Watson Ispra September 2020
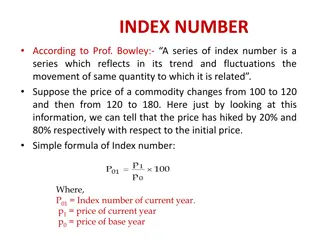
Human Development Index Formula ??????=1 3??+1 3? +1 3?? 1 3 ? 1 3 ?? 1 3 ??????= ?? with: log ? log(????) log ???? log(????) ??= ? ???? ???? ???? ??= for ? = ,?
Human Development Index ??????=1 ?+1 ?+1 ? ?? 3? 3?? 3 Thus, instead of looking at the tradeoff as an implication of the formulation, we directly use the tradeoff to derive the functional form (Chakravarty, 2011, p. 472)
This paper Discuss how a discrete choice experiment can be used to estimate the tradeoffs respondents make between the dimensions of the HDI Provide a proof-of-concept with a sample of about 1000 ECON students in four countries (BE, COL, ET, US)
Outline 1. A super-generalized HDI 2. Discrete choice approach 3. Data 4. Results 5. Conclusion
A super-generalized HDI A super-generalized HDI ??+? ? ??+?? ?? ?? ???????= ?? ?? with: ??=?? 1 ??= log(?) if ? 0 ? if ? = 0 This generalization allows for dimension-specific parameters ? and ?.
A super-generalized HDI MRS ?? 1 ?? 1 ????,?=?? ?? ??? ???? ??? ???? ???? ???? ? ?? ??
A super-generalized HDI MRS (Old HDI) ?? 1 ?? 1 ????,?=?? ?? ??? ???? ??? ???? ???? ???? ? ?? ??
A super-generalized HDI MRS (New HDI) 1 ????,?=?? ?? ?? ??? ???? ??? ???? ???? ???? ? ??
A super-generalized HDI MRS (Chakravarty HDI) ? 1 ????,?=?? ?? ?? ??? ???? ??? ???? ???? ???? ? ??
A super-generalized HDI MRS (super-generalized HDI) ?? 1 ?? 1 ????,?=?? ?? ??? ???? ??? ???? ???? ???? ? ?? ??
Outline 1. A super-generalized HDI 2. Discrete choice approach 3. Data 4. Results 5. Conclusion
Discrete choice approach: random utility model Utility consists of deterministic and stochastic part ??= ??+ ?? and ??= ??+ ??
Discrete choice approach: random utility model Utility consists of deterministic and stochastic part ??= ??+ ?? and ??= ??+ ?? Deterministic part is given by super-generalized HDI : ?? ??+?? ??? ?? ??= ?? ??? +?? ??? ?? ??+?? ??? ?? ??= ?? ??? +?? ??? So that: Pr ? = Pr ??> ?? = Pr ?? ??< ?? ??
Discrete choice approach: random utility model When errors are distributed according to extreme value distribution: (conditional) logit estimation Pr ? = Pr ??> ?? = Pr ?? ??< ?? ?? ??? ?? = ??? ??+??? ?? Maximum likelihood estimation
Discrete choice approach: random utility model Parameter restrictions can be tested with Likelihood Ratio tests Parameter restrictions H1 ?0:??= ??= ?? H1 ?0:??= ??= ??= 1 H1 ?0:??= ??= ??= 0 H2 ?0: ?= ?= ?
Outline 1. A super-generalized HDI 2. Discrete choice experiments 3. Data 4. Results 5. Conclusion
Data Paper-and-pencil questionnaire among ECON students Country Date University N Age Male BE Oct. 17, 2014 Univ. of Antwerp 470 18,68 39,44% CO Nov. 15, 2014 Univ. ICESI, Cali 205 20,27 53,17% ET April 17, 2015 Addis Ababa Univ. 249 28,70 62,34% US Sept. 19, 2015 Princeton Univ. 98 20,29 52,04% Non-representative sample Proof of concept
Discrete choice approach: implementation Respondents make 9 + 3 pairwise choices Dimensions take 3 levels (actual p20, p50, and p80) Country Dimension p20 p50 p80 BE Income per person (in euro) 750 1100 1600 Life expectancy (in years) 70 80 90 Education attainment (in years) 9 12 15 COL Income per person (in 1000 peso) 75 180 400 Life expectancy (in years) 60 75 85 Education attainment (in years) 2 6 11 ET Income per person (in Birr) 600 1000 1500 Life expectancy (in years) 20 45 75 Education attainment (in years) 2 6 12 US Income per person (in $) 650 1700 3500 Life expectancy (in years) 70 80 90 Education attainment (in years) 8 11 13
Outline 1. A super-generalized HDI 2. Discrete choice experiments 3. Data 4. Results 5. Conclusion
Outline 1. A super-generalized HDI 2. Discrete choice experiments 3. Data 4. Results 5. Conclusion
Belgium logarithm of likelihood logarithm of likelihood max -3.717 max 0.820 -1573 -1573 10% 10% 5% 5% -1575 -1575 2% 2% 1% 1% -1577 -1577 -6 -5 -4 -3 -2 0.40 0.60 0.80 1.00 1.20 omega income alpha income logarithm of likelihood logarithm of likelihood max -5.808 max 0.120 -1573 -1573 10% 10% 5% 5% -1575 -1575 2% 2% 1% 1% -1577 -1577 -10 -8 -6 -4 -2 0.04 0.08 0.12 0.16 0.20 omega life expectancy alpha life expectancy logarithm of likelihood logarithm of likelihood max 0.164 max 0.060 -1573 -1573 10% 10% 5% 5% -1575 -1575 2% 2% 1% 1% -1577 -1577 -8 -4 alpha education 0 4 8 -0.10 0.00 0.10 0.20 0.30 omega education
Belgium Weights are not equal Curvature parameters may be equal (but not equal to 0 or 1; rather -3) WTP for 1 year of life expectancy: 1,5% of income WTP for 1 year of education: 2,4% of income
Conclusion Proof-of-concept Discrete choice experiments seem a useful tool to determine the weights of a well-being index Formulating the experiment in a cross-country comparable way is challenging Equal weights are rejected, most subsamples reject equal curvature parameters
Conclusion Hopefully this debate will lead both users and producers of the HDI to think more critically in the future about what tradeoffs the index should assume in specific country settings (Ravallion, 2011, p. 478)
Results: weights for Belgium different framing Inspired by Benjamin et al. 2012 (AER)
Results: weights for Belgium different framing 233 respondents get both questions Life Satisfaction A B A 1158 (42%) 147 (6%) 1305 Preference B 177 (6%) 1263 (46%) 1440 1335 1410 2745