Conservation Efforts for Spring/Summer Chinook Monitoring and Evaluation Update
This update presents the latest findings and priorities for the monitoring and evaluation of Spring/Summer Chinook in the Lower Snake River Compensation Plan area. It covers performance reviews, programmatic changes, project goals, and allocation of compensation by state. The update also discusses improvements in production shifts and program refinements to enhance cooperator desires and address conservation goals effectively.

Download Presentation

Please find below an Image/Link to download the presentation.
The content on the website is provided AS IS for your information and personal use only. It may not be sold, licensed, or shared on other websites without obtaining consent from the author. Download presentation by click this link. If you encounter any issues during the download, it is possible that the publisher has removed the file from their server.
E N D
Presentation Transcript
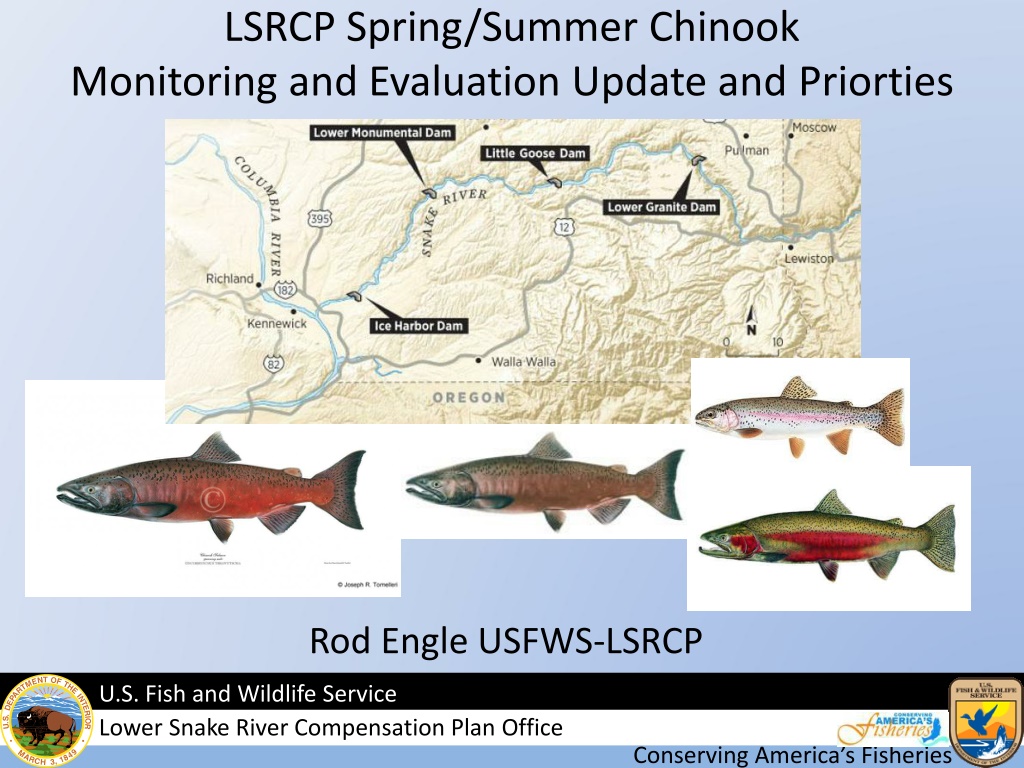
LSRCP Spring/Summer Chinook Monitoring and Evaluation Update and Priorties Rod Engle USFWS-LSRCP U.S. Fish and Wildlife Service Lower Snake River Compensation Plan Office Conserving America s Fisheries
M&E Update ISRP review highlights Current performance and programmatic changes for improvement AOP discussions on performance from ISRP M&E Priority Project List Future items U.S. Fish and Wildlife Service Lower Snake River Compensation Plan Office Conserving America s Fisheries
Project Area and Total Adult Spring/Summer Chinook Return Years 1987-2021 Project Area Spring/Summer Chinook Total Adult Spring/Summer Chinook (Objective = 234,000) LSRCP Project Area Goal (58,700) 70000 Number of Spring/Summer Chinook (All Ages) 60000 50000 40000 30000 20000 10000 0 1990 1995 2000 2005 2010 2015 2020 Return Year Reporting not complete for 2021 U.S. Fish and Wildlife Service Lower Snake River Compensation Plan Office Conserving America s Fisheries
Table 3. Allocation of compensation (adults) by State as suggested by Columbia Basin Fisheries Technical Committee (reproduced from WDFW 1974). This allocation was not to be used as a specific indicator of release sites. Washington Fall Chinook salmon Oregon Idaho Area or Basin Spring Chinook salmon Steelhead Spring Chinook salmon Steelhead Spring- Summer Chinook Steelhead Snake River Below Lewiston Lewiston Hells Canyon Hells Canyon Dam Tucannon River Clearwater River Asotin Creek Grande Ronde River Salmon River Imnaha River Small Tributaries Totals 5,000 9,728 3,648 2,208 1,368 1,200 1,368 1,152 1,632 68 288 20,736 816 5,856 7,632 46,656 16,896 68 3,216 1,920 264 11,184 288 48,432 264 39,264 1,152 18,512 4,656 9,072 U.S. Fish and Wildlife Service Lower Snake River Compensation Plan Office Conserving America s Fisheries
Large shift in production from Salmon to Clearwater basin. Why? LSRCP Programs Current Production 1,000,000 1,700,000 300,000 3,000,000 Basin Adult Goal 8,000 Basin Upper Salmon Upper Salmon Upper Salmon Facility McCall Sawtooth Sawtooth Location South Fork Salmon Sawtooth Weir Yankee Fork Basin Total 19,445 27,445 Clearwater Clearwater Clearwater Clearwater Clearwater Clearwater Clearwater Clearwater Clearwater Clearwater Clearwater Clearwater Dworshak Dworshak/NPTH North Fork Clearwater Clear Creek Lower Selway Red River Lochsa North Fork Clearwater Lapwai Basin Total 709,000 720,000 400,000 1,280,000 640,000 1,650,000 180,000 5,579,000 Further refinements of programs to achieve cooperator desires, ESA. Fishing, flexibility. 9,867 2,033 9,135 21,035 Since last review (2010), approximately 2.815 M smolt production has been added to address goals. Southeast Washington Southeast Washington Lyons Ferry/Tucannon Lyons Ferry/Tucannon Tucannon Touchet Basin Total 225,000 250,000 475,000 1,152 1,152 Northeast Oregon Northeast Oregon Northeast Oregon Northeast Oregon Northeast Oregon Lookingglass Lookingglass Lookingglass Lookingglass Lookingglass Catherine Lostine Upper Grande Ronde Lookinglass Creek Imnaha River Basin Total 150,000 250,000 250,000 250,000 490,000 1,390,000 970 1,617 1,617 1,617 3,210 9,031 Clearwater Pipeline would increase additional 3.0 M to existing infrastructure. Totals 10,444,000 (rounded) 58,700 U.S. Fish and Wildlife Service Lower Snake River Compensation Plan Office Conserving America s Fisheries
Performance LSRCP Spring/Summer Chinook Program Performance for ISRP Reviews - In Place/In Kind Mitigation Performance Balance Needed on in-place/in- kind Current Production 1,000,000 1,700,000 300,000 3,000,000 BY07-16 Mean SAR Expected adults Basin Adult Goal 8,000 Basin Upper Salmon Upper Salmon Upper Salmon Facility McCall Sawtooth Sawtooth Location South Fork Salmon Sawtooth Weir Yankee Fork Basin Total 0.50% 5,000 0.30% 6,000 19,445 0.91% 11,000 27,445 (16,445) Clearwater Clearwater Clearwater Clearwater Clearwater Clearwater Clearwater Clearwater Clearwater Clearwater Clearwater Clearwater Dworshak Dworshak/NPTH North Fork Clearwater* Clear Creek Lower Selway Red River Lochsa North Fork Clearwater Lapwai* Basin Total 709,000 720,000 400,000 1,280,000 640,000 1,650,000 180,000 5,579,000 0.24% 0.50% 0.43% 0.26% 0.26% 0.57% 0.57% 0.38% 1,709 3,564 1,724 3,328 1,664 9,405 1,026 22,420 9,867 2,033 9,135 21,035 1,385 Southeast Washington Southeast Washington Lyons Ferry/Tucannon Lyons Ferry/Tucannon Tucannon Touchet* Basin Total 225,000 250,000 475,000 0.18% 0.55% 0.24% 405 1,152 1,375 1,780 1,152 628 Northeast Oregon Northeast Oregon Northeast Oregon Northeast Oregon Northeast Oregon Lookingglass Lookingglass Lookingglass Lookingglass Lookingglass Catherine Lostine Upper Grande Ronde Lookinglass Creek Imnaha River Basin Total 150,000 250,000 250,000 250,000 490,000 1,390,000 0.58% 0.86% 0.44% 0.57% 0.62% 0.65% 870 970 2,150 1,100 1,425 3,038 8,583 1,617 1,617 1,617 3,210 9,031 (448) Totals 10,444,000 0.56% 43,783 58,700 (14,917) U.S. Fish and Wildlife Service Lower Snake River Compensation Plan Office Conserving America s Fisheries
Spring/Summer Chinook Example Increased Performance LSRCP Total Production 6,000,000 60,000 54,000 48,000 42,000 36,000 30,000 24,000 18,000 12,000 7,000,000 70,000 63,000 56,000 49,000 42,000 35,000 28,000 21,000 14,000 Where LSRCP Goal is met (58,700) 8,000,000 80,000 72,000 64,000 56,000 48,000 40,000 32,000 24,000 16,000 9,000,000 90,000 81,000 72,000 63,000 54,000 45,000 36,000 27,000 18,000 10,000,000 100,000 90,000 80,000 70,000 60,000 50,000 40,000 30,000 20,000 10,000 11,000,000 110,000 99,000 88,000 77,000 66,000 55,000 44,000 33,000 22,000 11,000 1.00% 0.90% 0.80% 0.70% 0.60% 0.50% 0.40% 0.30% 0.20% 0.10% Low Densities Better release sites Good homing Releases that are ready-to- migrate Better in-river survival, hydrosystem survival. Smolt programs over parr programs Endemic or localized stock 0.87 Project Area SAR 0.42 6,000 7,000 8,000 9,000 Increasing Costs ($) Increased Brood Need (and Reduced Fisheries) Started program with 6.74 M with expected survival of 0.87% = 58,700 Current program is 10.4 M with measured, mean survival of 0.42% (BY07-16) = 43,783 U.S. Fish and Wildlife Service Lower Snake River Compensation Plan Office Conserving America s Fisheries


 by State as")