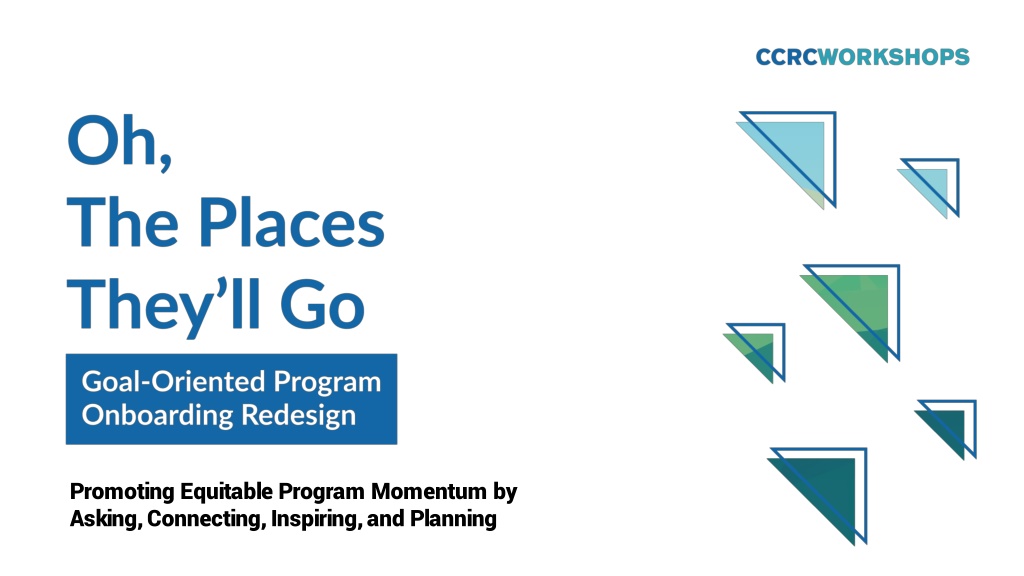
Reimagining Student Success: Equitable Program Onboarding Workshop
Explore how to enhance student retention and success in community colleges by reimagining the first-year experience through a framework focused on asking, connecting, inspiring, and planning. Discover the importance of program onboarding and learn from national data on student completion rates.

Download Presentation

Please find below an Image/Link to download the presentation.
The content on the website is provided AS IS for your information and personal use only. It may not be sold, licensed, or shared on other websites without obtaining consent from the author. Download presentation by click this link. If you encounter any issues during the download, it is possible that the publisher has removed the file from their server.
E N D
Presentation Transcript
Promoting Equitable Program Momentum by Asking, Connecting, Inspiring, and Planning
About this workshop Students come to community colleges with goals in mind. But most students never complete a degree or certificate, and in fact, about half of students leave by the start of their second year. Using national and college data, this workshop makes the case for reimagining students first year to ensure they know where their programs lead and what opportunities exist for future education and employment. This workshop presents a framework to facilitate equitable program onboarding (ACIP) by Asking students about their interests and aspirations, Connecting students with faculty and peers who share their interests, Inspiring students to learn, and helping students develop an individualized education Plan. o o o o
A few definitions Program of study: A program of study prepares students for transfer in a major or entry into the workforce. Onboarding: Onboarding is the process of helping students select, enter, and gain experience in a program of study. This process starts as soon as students apply and is not complete until students have chosen a program, built an educational plan, and taken and passed program gateway courses, which can take up to a year.
Discuss What experiences in college had the biggest impact on your choice of major?
Why focus on program onboarding?
Lets look at some national and college data
Many students who apply (and are accepted) to community college never even start classes of CC students who apply don t show up for the first day of classes 10-40% of students who apply to our college don t show up to the first day of classes ##%
After 6 years of enrollment, most students have not completed a degree or credential of CC students nationally complete any degree or credential within 6 years 40% of our students complete any degree or credential within 6 years ##% Source: NSC Completing College 2020, which tracks six-year highest outcomes for the fall 2014 FTIC (includes former dual enrollment) degree-seeking cohort.
Six years after enrolling, 41% of students are no longer enrolled, and 19% are still enrolled Highest Outcomes in Six Years Among First-Time-in-College Community College Entrants 25% 35% 39% 39% 41% 50% 24% Not enrolled (no credential) 16% 19% 23% 25% Still enrolled (no credential) 22% 22% Completed at 4 year 28% 17% 14% 17% Completed at CC 10% 27% 23% 23% 23% 21% 18% Overall Asian Black Latinx White Two or more races Source: NSC Completing College 2020, which tracks the fall 2014 FTIC (includes former dual enrollment degree-seeking cohorts) https://nscresearchcenter.org/wp-content/uploads/Completions_Report_2020.pdf
[Customize slide title with an observation about your data] Highest Outcomes in Six Years Among First-Time-in-College Community College Entrants 25% 35% 39% 39% 41% 50% 24% Not enrolled (no credential) 16% 19% 23% 25% Still enrolled (no credential) 22% 22% Completed at 4 year 28% 17% 14% 17% Completed at CC 10% 27% 23% 23% 23% 21% 18% Overall Asian Black Latinx White Two or more races Source: NSC Completing College 2020, which tracks six-year highest outcomes for the fall 2014 FTIC (includes former dual enrollment) degree-seeking cohort.
One reason why completion rates are so low is fall-to-fall retention rates are also low Of students who entered community colleges in fall 2018 returned to the same institution in fall 2019 54% Of students who entered our college in fall 2018 returned to the same institution in fall 2019 ##% Source: NSC Research Center, First-Year Persistence and Retention Fall 2018 Cohort. Snapshot Report, Summer 2020. Data are for fall 2018 first-time college students at two-year public institutions.
And retention rates are lower for students from underserved groups Year 2 retention rates by race/ethnicity 64% 58% 55% 54% 45% Overall Asian White Black Latinx National Your college Source: NSC Research Center, First-Year Persistence and Retention Fall 2018 Cohort. Snapshot Report, Summer 2020. Data are for fall 2018 first-time college students at two-year public institutions.
Because enrollments are declining, its more important than ever to focus on onboarding and retaining the students we have National enrollment trends [insert screenshot of your college s fall undergraduate enrollment here] College enrollment trends Source: https://public.tableau.com/profile/john.fink#!/vizhome/UndergraduateEnrollmentTrendsbySector/Summary
Being in a program from the start makes it more likely for a student to maintain enrollment at the college into year 2, and to complete their program however, many CC students are not in programs.
% of students in AA/Liberal Arts/General Studies ##% ##% % of dual enrollment students % of noncredit/non- degree continuing education students ##%
How to reimagine program onboarding through Ask- Connect-Inspire-Plan
Ask Connect Inspire Plan
ACIP provides a framework for scaling and personalizing guided pathways reforms. Universal structures, practices, and policies apply to all students Personalized support can be: Tailored based on the needs and interests of a group of students Individualized by customizing practices to a specific student
Ask Every student is engaged in an ongoing conversation about their interests, strengths, and aspirations and is guided to programs and people at the college with similar interests.
Asking students about their interests and aspirations Intake surveys and career assessments Additional advising and support for undecided students Introducing middle and high school students to career options
Connect From the start, colleges organize opportunities for all students to meet with faculty, students, alumni, and employers in fields of interest to them.
Connecting students to academic and career communities (meta-majors) Orientation and advising based on meta-majors Program and field showcase events Faculty liaisons to meta-majors/career communities
Inspire Every student takes at least one course in term 1 on topics of interest that light their fire for learning
Inspiring students to learn Program-relevant courses for all students in the first term Service learning and project-based learning Active and co-curricular learning techniques with dual enrollment students Professional development for faculty
Plan Help every student to develop a full-program educational plan that shows them a path to their goals.
Planning a path to help students achieve their goals To ensure every student has a path, plans should be: required as part of advising and first-year experience courses built to cover the entire program through completion or transfer based on a standard program map, but customized for each student easily accessible regularly monitored and updated tied to scheduling and registration o o o o o o
Discuss What support for choosing your major do you wish you had in college?
Placing equity at the center of onboarding In order to achieve equity in outcomes for marginalized and underserved students, it is critical to tailor onboarding support to meet the needs of different student groups, for example: Undecided students Adult students Recent high school graduates Dual enrollment students Students enrolled in basic skills programs Students from racial/ethnic groups historically excluded from higher education English learners Military students International students Students with disabilities Additional target populations at our college
What students say they want during onboarding Assistance exploring academic and career interests Information on program options in fields of interest and their connection to career and baccalaureate transfer opportunities Opportunities to interact with other new and current students, faculty, and others who share similar academic and career interests The chance to take a course on topics of interest in term 1 Assistance developing a full-program academic and financial plan Note: Students who have clear career goals need different kinds of support than those who don t Source: Kopko and Griffin (2020). https://ccrc.tc.columbia.edu/publications/redesigning-community-college-onboarding-guided-pathways.html
Mapping the program onboarding experience using ACIP At what points do students have the opportunity to ask, connect, be inspired, and create a plan during onboarding?
Mapping the program onboarding experience What groups of students do not benefit from such experiences (e.g., transfer students, noncredit student, dual enrollment student, etc.)? What do students currently experience related to this design principle? Program onboarding design principle ASK every student about their interests, strengths, aspirations. CONNECT them with faculty, students, alumni, others with similar interests. INSPIRE learning in term 1 through light the fire college-level courses on topics of interest Help every student development an individualized education PLAN aligned to jobs/transfer in field of interest by end of term 1
Reimagining the program onboarding experience How can we enrich the onboarding experience for all students while tailoring it for specific underserved groups?
Case study: adult students and onboarding Varying amounts of time out of education Varying prior college experience Different life experiences Different career experiences No clear institutionalized supports for college planning
Your own case study Insert content here Insert content here Insert content here Insert content here Insert content here
Reimagining the program onboarding experience What groups of students do not benefit from such experiences (e.g., transfer students, noncredit students, dual enrollment students, etc.)? What do students currently experience related to this design principle? Program onboarding design principle ASK every student about their interests, strengths, aspirations. CONNECT them with faculty, students., alumni, others with similar interests INSPIRE learning in term 1 through light the fire college-level courses on topics of interest. Help every student development an individualized education PLAN aligned to jobs/transfer in field of interest by end of term 1
What are your boldest ideas for reimagining program onboarding?
Next steps Reflect on your major takeaways from the workshop. How do these ideas connect with your role at the college?
Thanks for participating! [insert presenter/s names and contact information]
College example slides Success Stories from Colleges Doing Ask- Connect-Inspire-Plan and Guided Pathways
Increasing Student Success through Guided Pathways and Ask-Connect-Inspire-Plan Evidence from Three Colleges
Making sense of the data Guided pathways is a comprehensive framework encompassing multiple college-wide reforms intended to be implemented at scale for all new students. The cumulative effect of implementing multiple core components at scale is what is likely to have the biggest influence on student outcomes. The following case studies are not an exhaustive representation of the colleges work, but rather serve to illustrate key examples of how pathways practices support ACIP strategies. While it would be extremely difficult to attribute changes in student outcomes to any one single component, it is likely that these practices played a significant role in contributing to the improvements in student outcomes presented in the data.
About the colleges Alamo Colleges^ Sinclair Zane State Location San Antonio, TX Dayton, OH Zanesville, OH Enrollment (Fall 2020) 68,319 18,687 2,223 Percent part-time (Fall 2020) 82% 79% 69% Asian: 2% Black: 7% Hispanic: 63% White: 21% Asian: 2% Black: 14% Hispanic: 4% White: 66% Asian: 1% Black: 1% Hispanic: 1% White: 88% Race/ethnicity (Fall 2020) Pell grants (2019-2020) 57% 40% 54% Three-year graduation rate 29%# 26%* 39%* Source: https://nces.ed.gov/collegenavigator/
ACIP practices | The Alamo Colleges Transfer and career-technical education programs organized into six Institutes (meta-majors) o Ask: During orientation sessions organized by Institute, students participate in group advising o Ask: Enrollment coaches help students select an Institute that will be a good fit o Connect: Advisors assigned based on Institute Active and experiential learning opportunities o Inspire: The colleges are developing an initiative to guarantee all students have the chance to take part in experiential learning Full-program education plans o Plan: Students meet with their advisor and develop a full-program education plan as part of a required first-year experience course
Student outcomes | The Alamo Colleges Time and credits to an associate degree: Decreased from 4.6 years and 94 credits in 2016 to 3.8 years and 82 credits (66 for students who began at the Alamo Colleges) in 2019. Three-year graduation rate: Increased from 9% for the 2010 cohort to 30% for the 2016 cohort. Source: Funding Guided Pathways: A Guide for Community College Leaders
ACIP practices | Sinclair Community College (1/2) Programs organized into six career communities (meta-majors) Ask: Recruiting events and campus tours organized by career community Ask: Career assessments aligned with career communities Connect: Advisors assigned based on career community Connect: In addition to a college-wide orientation that includes an overview of career communities, students attend a program-specific orientation to build more direct connections to their program Connect: Conversations with Experts career events organized by program or career community o o o o o
ACIP practices | Sinclair Community College (2/2) Active and experiential learning opportunities Connect: Work-based learning department for apprenticeships, pre- apprenticeships, internships, and career development Inspire: Service learning aligned with career communities Full-program education plans Plan: Advisors create full plans with students within the first or second term using Student Success Planning o o o
Student outcomes | Sinclair CC Course success rates: Increased from 70% in FY 2013 to 79% in FY 2021. Among minoritized students, course success rates increased from 58% to 72%. Three-year graduation rate: Increased from 6% in 2005 to 30% in 2020. Among minoritized students, the graduation rate increased from 1% to 23%. Average credit hours completed by associate degree graduates: Decreased from 84 in FY 2010 to 72 in FY 2021. o o Source: Sinclair College Strategic Plan for Student Completion 2020 -2025
ACIP practices | Zane State College Programs organized into five meta-majors o Ask: Orientation organized by meta-major to facilitate targeted program exploration o Ask: First-year experience course organized by meta-major includes career exploration assignments, such as completing an interest inventory and creating a portfolio that describes how students strengths will help them in their program and career. o Connect: Faculty meet with small groups of students during orientation o Connect: Joint advising from success coaches and from faculty advisors (assigned by meta-major) Full-program education plan o Plan: As part of the mandatory first-year experience course, students are required to meet with their success coach and complete an education plan
Student outcomes | Zane State College Completion of 12+ credits in the first term: Increased from 15% FTEIC students in 2014 to 38% in 2019. Completion of 24+ credits in the first year: Increased from 15% FTEIC students in 2014 to 32% in 2019. Average credit hours completed by graduates: Decreased from 80 in 2012 to 73 to in 2017. Source:Zane State College


 to")