Youth Mental Health Trends in Washington State Schools
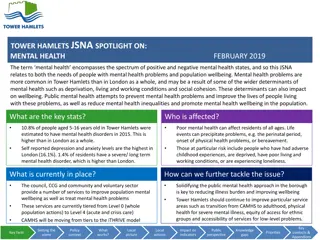
Analyzing the trends of depression, suicide ideation, suicide planning, and suicide attempts among 8th, 10th, and 12th-grade students in Washington State schools over the past few years. The data reveals concerning percentages of students reporting feelings of hopelessness, considering suicide, making plans for suicide, and attempting suicide. Additionally, there is a focus on suicide ideation and attempt rates among 6th graders, as well as awareness and literacy levels regarding suicide warning signs among students in the state.

Download Presentation

Please find below an Image/Link to download the presentation.
The content on the website is provided AS IS for your information and personal use only. It may not be sold, licensed, or shared on other websites without obtaining consent from the author. Download presentation by click this link. If you encounter any issues during the download, it is possible that the publisher has removed the file from their server.
E N D
Presentation Transcript
The Intersection of Youth and Mental Health Needs A discussion of school-based mental health service delivery models in Educational Service Districts across Washington State
DEPRESSION WASHINGTON STATE SCHOOLS: PAST 12 MONTHS DEPRESSION TREND % of 8th, 10th, & 12th grade students reporting feeling sad/hopeless for two or more weeks 50.0% Question: During the past 12 months, did you ever feel so sad or hopeless every day for two weeks or more in a row that you stopped doing some usual activities? 40.0% 36.7% 34.9% 34.5% 33.7% 30.9% 30.4% 27.7% 30.0% 27.2% 25.9% 20.0% 10.0% 0.0% 8TH GRADE 10TH GRADE 12TH GRADE 2012 2014 2016
CONSIDERED SUICIDE WASHINGTON STATE SCHOOLS: PAST 12 MONTHS CONSIDERED SUICIDE TREND % of 8th, 10th, & 12th grade students who reported seriously considering suicide 50.0% Question: During the past 12 months, did you ever seriously consider attempting suicide? 40.0% 30.0% 20.6% 20.5% 20.2% 18.8% 18.1% 20.0% 16.9% 16.7% 16.7% 16.1% 10.0% 0.0% 8TH GRADE 10TH GRADE 12TH GRADE 2012 2014 2016
MADE A PLAN WASHINGTON STATE SCHOOLS: PAST 12 MONTHS MADE A PLAN TREND % of 8th, 10th, & 12th grade students who reported making a plan to commit suicide 50.0% Question: During the past 12 months, did you make a plan about how you would attempt suicide? 40.0% 30.0% 20.0% 17.0% 16.4% 16.3% 14.3% 14.3% 13.9% 13.7% 13.5% 13.4% 10.0% 0.0% 8TH GRADE 10TH GRADE 12TH GRADE 2012 2014 2016
ATTEMPTED SUICIDE WASHINGTON STATE SCHOOLS: PAST 12 MONTHS ATTEMPTED SUICIDE TREND % of 8th, 10th, & 12th grade students who reported attempting suicide one or more times 50.0% Question: During the past 12 months, how many times did you actually attempt suicide? 40.0% 30.0% 20.0% 10.2% 10.1% 8.9% 8.7% 8.4% 8.3% 7.8% 7.6% 10.0% 6.3% 0.0% 8TH GRADE 10TH GRADE 12TH GRADE 2012 2014 2016
SUICIDE IDEATION/ATTEMPT (6THGRADE) WASHINGTON STATE SCHOOLS: SUICIDE IDEATION/ATTEMPT (LIFETIME) 6TH GRADE TREND % of 6th graders responding yes 50.0% Questions: Have you ever seriously thought about killing yourself? Have you ever tried to kill yourself? 40.0% 30.0% 20.0% 15.0% 14.6% 14.5% 10.0% 4.8% 4.5% 4.5% 0.0% 2012 2014 2016 Suicidal Ideation Attempted Suicide
AWARENESS/LITERACY WASHINGTON STATE SCHOOLS: AWARENESS ON WARNING SIGNS OF SUICIDE (LAST YEAR) TREND % of 8th, 10th, & 12th grade students who report receiving information about warnings of suicide and how to get help 100.0% Question: Last year, did you hear or see information at your school about the warning signs of suicide and how to get help for yourself or a friend? 90.0% 80.0% 70.0% 60.0% 54.3% 53.7% 50.9% 47.5% 50.0% 38.6% 37.5% 40.0% 30.0% 20.0% 10.0% 0.0% 8TH GRADE 10TH GRADE 12TH GRADE 2014 2016
ADULT SUPPORT WASHINGTON STATE SCHOOLS: PAST 12 MONTHS ADULT TO TURN TO FOR HELP TREND % of 6th, 8th, 10th, & 12th grade students who report no/unsure 50.0% Question: When you feel sad or hopeless, are there adults you can turn to for help? Findings demonstrate the percentage of student who reported no or not sure. (A lower percentage is optimal). 40.0% 29.1% 28.5% 28.3% 30.0% 26.9% 26.4% 25.3% 24.8% 24.3% 18.0% 20.0% 17.2% 17.1% 13.7% 10.0% 0.0% 6TH GRADE 8TH GRADE 10TH GRADE 12TH GRADE 2012 2014 2016


")