Advanced Career Coaching Strategies for Educational Success
This presentation delves into the innovative approach of Career Coaching within the Northampton Lehigh Carbon Luzerne PATH consortium. It focuses on the practical implementation and impact of Career Coaching, contrasting it with traditional academic advising. Through examining effectiveness, sustainability, and participant satisfaction, the presentation aims to highlight the benefits of integrating Career Coaching into educational programs.

Uploaded on Oct 07, 2024 | 0 Views
Download Presentation

Please find below an Image/Link to download the presentation.
The content on the website is provided AS IS for your information and personal use only. It may not be sold, licensed, or shared on other websites without obtaining consent from the author. Download presentation by click this link. If you encounter any issues during the download, it is possible that the publisher has removed the file from their server.
E N D
Presentation Transcript
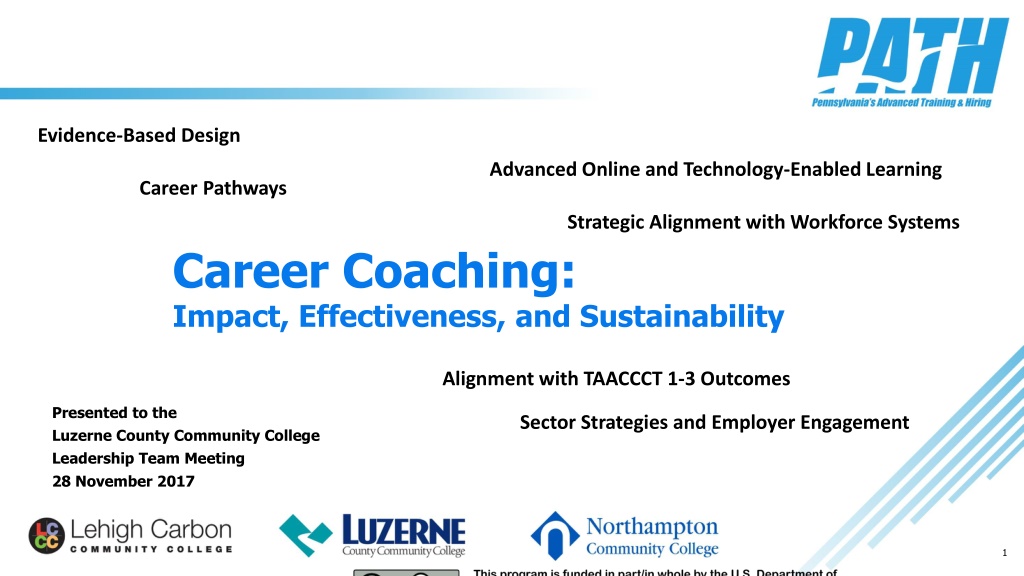
Evidence-Based Design Advanced Online and Technology-Enabled Learning Career Pathways Strategic Alignment with Workforce Systems Career Coaching: Impact, Effectiveness, and Sustainability Alignment with TAACCCT 1-3 Outcomes Presented to the Luzerne County Community College Leadership Team Meeting 28 November 2017 Sector Strategies and Employer Engagement 1
Table of Contents Introduction The How and the Why of Career Coaching Participant Satisfaction The Role of Persistence Sustainability: Two Thought Experiments 2 2
Introduction The goal of this presentation is to represent the process of Career Coaching in the Northampton Lehigh Carbon Luzerne PATH consortium While intrusive advising is a well-known and successful strategy, it is often implemented or tested in structured programs with lower caseloads Colleges are therefore faced with a difficult choice regarding who and how many students can benefit from increased access to supportive services Career Coaching is a different model where the Career Coach is integrated into the program of study (PUSH, not PULL) rather than assigned a discrete student caseload Therefore, we would like to examine the what, how and why of Career Coaching: How is it performed and why is it meaningful to the student? Is it impactful, in that it makes a positive, long-lasting impression on the student Is it effective, in that the benefits are consistent and measurable? Is it sustainable, in that colleges should choose to continue this strategy? 3 3
Table of Contents Introduction The How and the Why of Career Coaching Participant Satisfaction The Role of Persistence Sustainability: Two Thought Experiments 4 4
Academic Advising vs. Career Coaching Career Coaching Guides the client in expressing career dreams, desires, drivers and goals. Addresses the whole person Partners with the student accountable for intake paperwork, assessments, and feedback Acts as a strategist for careers: guides them to make decisions on their own May assist with job search materials: resumes, cover letters, applications Serves as Chief Motivational Officer Academic Advising Offers professional academic advice Helps students change, not choose, majors Assists in evaluating transcripts Can be a referral source for other support services (tutoring, career development, etc) 5 5
Table of Contents Introduction The How and the Why of Career Coaching Participant Satisfaction The Role of Persistence Sustainability: Two Thought Experiments 6 6
Participant Satisfaction PATH Satisfaction Survey Responses Luzerne County Community College Satisfaction vs. Caseload 100 100 % V/Satisfied with PATH 83.3 79.4 90 80 68.8 60.8 80 60 50 40 70 20 60 0 Round 1 Round 2 Round 3 50 0 20 40 60 80 100 120 The PATH course/program is helping me reach my goals Average Caseload Overall Satisfaction with PATH Satisfaction survey responses show an increase over time, as students have increasing exposure to Career Coaching and Job Development Likewise, the data also shows sharp drops in Satisfaction (Luzerne s Round 1 survey) when there are issues in providing these services Preliminary data also points to a weak to null relationship between satisfaction and caseload Our working hypothesis is that this is driven by the Career Coaching model (frequent, short, personal interventions) Future research may test the durability of this relationship, as well as whether it can be generalized 7 7
Coaching Services Offered (and Used) Satisfaction among Participants Using Service PATH Career Coaching Services Used Luzerne County Community College Job Interview Training 86% Job Placement Assistance 82% Job Interview Training 5.6 Assistance Finding an Internship/Practicum 79% Career Counseling/Assessment 81% Job Placement Assistance 44.4 Job Search Assistance 90% Resume Building/Development 76% Assistance Finding an Internship/Practicum 11.1 Information About Job Fairs 80% 65% 70% 75% 80% 85% 90% 95% Career Counseling/Assessment 27.8 % Very/Satisfied Job Search Assistance 50 We observe the highest satisfaction among participants who use the high-touch cluster of services, such as Job Search Assistance, but even low-touch services, such as Information about Job Fairs, boost satisfaction Resume Building/Development 44.4 Information About Job Fairs 55.6 0 10 20 30 40 50 60 8 8
Table of Contents Introduction The How and the Why of Career Coaching Participant Satisfaction The Role of Persistence Sustainability: Two Thought Experiments 9 9
Persistence for PATH Participants Persistence: the ability of a program to keep students enrolled from semester to semester and year to year Technical definition: of students enrolled in a given Fall semester, how many are enrolled in the next Spring (F-S) or Fall (F- F) semester, without reference to the reason for non-enrollment (voluntary withdrawal, involuntary withdrawal, completion, transfer, left area ) Most intrusive-advising strategies use persistence as a key metric ALSO an area where community colleges (2-year, public institutions) are historically very weak 10 10
Persistence compared to overall PATH Fall-Spring Persistence Luzerne County Community College PATH Fall-Fall Persistence Luzerne County Community College 100 100 100 90 90 90 80 80 69 69 70 70 College-wide: 71% 60 60 50 50 College-wide: 50% 40 40 30 30 Fall 2015 Fall 2016 Fall 2015 Fall 2016 Compared to the overall community college persistence rates, PATH programs do exceptionally well in terms of returning students from semester to semester and year to year PATH participants, as credit students within the community college, are able to access all services available to a regular student; the major difference is access to interventions through career coaching Averaged across all available semesters, Fall-Fall Persistence is 12% higher for PATH participants than overall college students 11 11
Persistence compared to Like Programs Fall-Spring Persistence PATH-funded EDMT vs. Similar Programs Fall-Fall Persistence PATH-funded EDMT vs. Similar Programs 100% 93% 100% 100% 86% 80% 80% 62% 62% 62% 58% 58% 58% 60% 60% 39% 38% 36% 40% 40% 20% 20% 0% 0% FA2015 FA2016 Overall FA2015 FA2016 Overall Matched Programs PATH EDMT Matched Programs PATH EDMT As PATH students are all in career-training streams, we can also compare against matched programs, with similar intake populations, CIP codes, and target industries We see a 30-40% increase in Fall-Spring persistence and a 23-26% increase in Fall-Fall persistence The major difference between programs is the availability of Career Coaching and other supportive services, funded by the PATH grant 12 12
Table of Contents Introduction The How and the Why of Career Coaching Participant Satisfaction The Role of Persistence Sustainability: Two Thought Experiments 13 13
Making Career Coaching Sustainable While career coaching has a positive impact on student success metrics, that does not make it sustainable What could make it sustainable? It could be part of the expected standard of education It could be funded by a third party over the long term It could be the best use of scarce funds What could make it difficult to replicate? 14 14
Persistence Has Value, Too Career Coaching improves Persistence If a community college is less than fully subscribed, a student that persists is a student that doesn t have to be recruited If a community college s operating catchment is aging or shrinking, improving persistence can be a way to keep the doors open when additional recruitment is no longer feasible Two thought experiments Persistence as an alternative to marketing budgets Persistence as a mechanism to increase tuition revenue 15 15
Thought Experiment: Dont Recruit, Persist As an experiment, let s consider the impact of enhancing persistence rather than recruiting/recapturing Assume that the incremental cost to recruit a single student is roughly the marketing budget divided by the number of new students in the following year Assume that improved persistence over baseline can be directly attributed to the career coach Therefore, the value of a career coach in marketing terms is the cost to recruit one student, times the number of additional students that we expect to re-enroll Can a career coach pay for themselves? 16 16
Thought Experiment: Dont Recruit, Persist Working out the benefits using PATH numbers Marketing budget per new enrollment: range from $277 to $319 per new enrollment, and a mean of $298 Increase in persistence: range from 20% to 40% Average PATH Career Coach Caseload: range from 15 to 117 students and a mean of 61 Marketing-dollar value added per PATH Career Coach: between $3400 and $7800 per year, using the mean caseload, and a high of $15000 using the maximum PATH caseload This omits all other potential sources of value, such as increased tuition paid, as well as desirable non-dollar attributes, such as increased completion, increased satisfaction, improved enrollment numbers or ability to balance enrollment over the business cycle, support of strategic programs, and so on 17 17
Thought Experiment: More Students, Not Increased Tuition As an experiment, let s consider the impact on tuition income from improved persistence As in the case before, we assume that improved persistence over baseline can be directly attributed to the career coach We also assume that faculty costs are variable, but all other budgeted costs are fixed. Therefore, the budget value of one incremental student is the difference between tuition paid and their share of faculty salaries (total salary divided by student FTE s) In this thought experiment, the value of a career coach is the income derived from tuition, less the cost of faculty time to offer those courses, times the number of additional students we expect to re-enroll 18 18
Career Coaching Benefits To close, we can see that the community college benefits from career coaching in at least three distinct ways Improvements in the financial picture, through increased tuition income and savings in marketing income Improvements in the performance picture, through improved KPIs in student persistence and completion Improvements in the satisfaction picture, through improved Overall Satisfaction and Would- Recommend satisfaction metrics 19 19
Questions? 20 20
Supplementary Data Barriers to Completion Deficient Math Skills Deficient Reading Skills Limited Job Oppts. w/o trng. Lacks General Skills First Limited Family Support Limited Financial Support Limited Access to Transport TAA Eligible Age at Enrollment Limited Work Exp. Long-term Unempl. Lacks Req. Credential Criminal Record Generation Student Successful Graduation Employed Minority Employed -0.201 -0.185 0.012 -0.076 -0.103 -0.205 -0.023 -0.205 -0.103 0.020 -0.103 -0.075 0.082 0.130 -0.117 0.169 Minority -0.026 0.042 0.085 0.211 0.108 -0.034 0.108 0.006 -0.082 0.108 0.008 -0.079 -0.126 0.121 -0.328 TAA -0.209 0.215 -0.040 0.142 0.160 0.142 0.142 0.059 0.142 0.203 -0.033 0.090 -0.023 -0.108 AgeNumber -0.079 0.074 -0.098 0.033 -0.118 -0.108 0.083 -0.068 0.011 0.064 0.084 -0.014 -0.087 MathBarrier 0.508 -0.040 0.047 -0.040 -0.040 0.180 0.142 0.203 0.190 -0.053 -0.023 -0.171 ReadingBarrier -0.021 -0.034 -0.021 -0.021 -0.032 -0.021 0.214 -0.017 -0.027 -0.012 -0.162 LimJobBarrier 0.178 -0.021 0.320 0.194 0.660 0.214 -0.017 -0.027 0.573 -0.044 LimWorkBarrier 0.178 0.602 0.510 0.178 0.406 0.231 0.121 0.345 -0.098 LTUnemplBarrier 0.320 -0.032 -0.021 -0.029 -0.017 -0.027 -0.012 -0.162 LacksCredBarrier 0.420 0.320 0.214 -0.017 -0.027 0.573 -0.162 LacksSkillsBarrier 0.194 0.439 0.250 0.135 0.370 -0.121 CrimRecBarrier 0.214 -0.017 -0.027 0.573 -0.162 FirstGenBarrier 0.273 0.341 0.401 -0.063 FamSupportBarrier 0.302 -0.010 0.060 FinSupportBarrier -0.015 -0.088 TransportBarrier -0.160 21 21
Supplementary Data Standardized coefficients for Individual Attributes (90% conf. interval) Standardized coefficients for Barriers to Completion (90% conf. interval) FamSupportBarrier Employed 0.2 Standardized coefficients 0.1 2 CollegeAge Education 0 -0.1 1.5 TAA -0.2 1 -0.3 LacksSkillsBarrier LacksCredBarrier LimWorkBarrier FirstGenBarrier CrimRecBarrier ReadingBarrier LimJobBarrier -0.4 Minority Variable Standardized coefficients 0.5 -0.5 0 Standardized coefficients for Education Level (90% conf. interval) FinSupportBarrier LTUnemplBarrier MathBarrier -0.5 0.3 Standardized coefficients Associate's 0.2 -1 Some College 0.1 HS/GED -1.5 0 No Response Prof/Grad -0.1 -2 TransportBarrier -0.2 -2.5 -0.3 Bachelor's Variable Variable 22 22


")