Preschool Least Restrictive Environment: Indicator 6 under IDEA
The State Performance Plan (SPP) and Annual Performance Report (APR) for 2020-2025 focus on Indicator 6 of the Individuals with Disabilities Education Act (IDEA) concerning Preschool Least Restrictive Environment. This plan evaluates state efforts to implement IDEA requirements and improve their implementation. It measures preschool services in various settings and sets targets for performance improvement. The presentation includes key terms, frequently used terms, and emphasizes the importance of educating preschool children with disabilities in the least restrictive environment as per Part B of IDEA.

Download Presentation

Please find below an Image/Link to download the presentation.
The content on the website is provided AS IS for your information and personal use only. It may not be sold, licensed, or shared on other websites without obtaining consent from the author. Download presentation by click this link. If you encounter any issues during the download, it is possible that the publisher has removed the file from their server.
E N D
Presentation Transcript
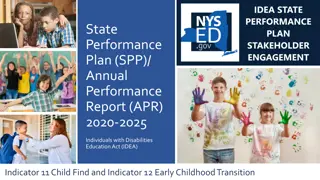
State Performance Plan (SPP)/ Annual Performance Report (APR) 2020-2025 Individuals with Disabilities Education Act (IDEA) Indicator 6 Preschool Least Restrictive Environment
Agenda Preschool Least Restrictive Environment Frequently Used Terms for Preschool Least Restrictive Environment Indicator 6 How the Measurement Works Indicator 6 Data in New York State (Trends and Comparisons) Indicator 6 Improvement Activities Indicator 6 Proposed Target Setting Next Steps and Closing 2 Preschool LRE Agenda
Frequently Used Terms in the Presentation Term Description State Performance Plan or SPP Evaluates the state s efforts to implement the requirements and purposes of the IDEA and describes how the state will improve its implementation Federal Fiscal Year or FFY Federal Government Fiscal Year (October 1 September 30) Indicator 6 SPP Indicator 6 measures Preschool Least Restrictive Environment Indicator 6A Indicator 6A measures preschool services in a regular early childhood program Indicator 6B Indicator 6B measures preschool services in a separate special education class, separate school or residential facility. Indicator 6C Indicator 6C measures preschool services in the home setting Baseline Data starting point to measure improvement overtime Targets Performance Objectives set for SPP Measurements Annual Performance Report (APR) Reported Data Data reported to the United States Department of Education Office of Special Education Programs (OSEP) against the state s targets Data Equated to New Measurement Submitted Data recalculated using the components of a new measurement 3 Key Terms Used in the Preschool LRE Presentation
Least Restrictive Environment A preschool child with a disability is entitled to all the rights and protections guaranteed under Part B of the IDEA, including the right to be educated in the least restrictive environment (LRE). 4
Part B LRE requirements state a strong preference for educating children with disabilities in regular classes alongside their peers without disabilities. 5
The United States Department of Education January 2017 Guidance Dear Colleague Letter (DCL) related to Preschool Least Restrictive Environments (LRE) (PDF) is an effective resource to highlight the importance of preschool inclusion and outline the IDEA preschool least restrictive environment requirements. 6 IDEA Preschool LRE Requirements
Policy Statement on Inclusion of Children with Disabilities in Early Childhood Programs: U.S. Departments of Education and Health and Human Services "Inclusion in early childhood programs refers to including children with disabilities in early childhood programs, together with their peers without disabilities; holding high expectations and intentionally promoting participation in all learning and social activities, facilitated by individualized accommodations; and using evidence-based services and supports to foster their development (cognitive, language, communication, physical, behavioral, and social-emotional), friendships with peers, and sense of belonging. This applies to all young children with disabilities, from those with the mildest disabilities, to those with the most significant disabilities. U.S. Departments of Health and Human Services and Education, Policy Statement on Inclusion of Children with Disabilities in Early Childhood Programs (2015) 7 LRE Policy Statement
Indicator 6 Preschool LRE FFY 2013-19 Measurement Targets are established by the State with Stakeholder Input For data collection purposes, a Regular Early Childhood Program is a program that includes a majority (at least 50 percent) of children who do not have IEPs and that may include, but is not limited to: Head Start; Kindergartens; Preschool classes offered to an eligible pre-kindergarten population by the public school system; Private kindergartens or preschools; Group child development centers or child care. Percent of children aged 3 through 5 with individualized education programs (IEPs) attending a: A. Regular early childhood program and receiving the majority of special education and related services in the regular early childhood program. Improvement = Increase over Baseline B. Separate special education class, separate school or residential facility. Improvement = Decrease over Baseline 8 Indicator 6 Measurement for 2015-2019
Indicator 6 Preschool LRE FFY 2020-25 Measurement Targets are established by the State with Stakeholder Input Percent of children with individualized education programs (IEPs) aged 3, 4, and aged 5 who are enrolled in a preschool program attending a: New Measurement: States must report only those five-year-old children with disabilities who are enrolled in preschool programs in this indicator. A. Regular early childhood program and receiving the majority of special education and related services in the regular early childhood program. New Measurement Component: Home Environment. Home is the unduplicated total who received the majority of their special education and related services in the principal residence of the child's family or caregivers, and who attended neither a Regular Early Childhood Program nor a Special Education Program provided in a separate class, separate school, or residential facility. Improvement = Increase over Baseline B. Separate special education class, separate school or residential facility. Improvement = Decrease over Baseline C. Receiving special education and related services in the home. States may choose to set one target that is inclusive of children ages 3, 4, and 5, or set individual targets for each age. Improvement = Decrease over Baseline 9 Indicator 6 Measurement for 2020-2025
Data Collection Methodology for Indicator 6 Data is collected for all children in New York State who meet the age requirements. Sampling is not allowed. Preschool environment data is reported annually as a snapshot or point in time as of the first Wednesday in October (BEDs Day). Code PS04 PS05 PS06 PS07 PS08 Preschool Least Restrictive Environment Code Description Separate Class Separate School Residential Facility Home Service Provider Location or some other location that is not in any other code PS09 Attending a regular early childhood program for 10 or more hours a week and receiving the majority of hours of special education and related services in the regular early childhood program PS10 Attending a regular early childhood program for 10 or more hours a week and receiving the majority of hours of special education and related services in some other location Attending a regular early childhood program for less than 10 hours a week and receiving the majority of hours of special education and related services in the regular early childhood program PS11 PS12 Attending a regular early childhood program for less than 10 hours a week and receiving the majority of hours of special education and related services in some other location 10 Data Collection Methodology
Facilitator check for understanding on the SPP measurement for Indicator 6 and how the data is used to measure results or outcomes in LRE.
Indicator 6 New York State Data New York State Data Trends and Comparisons
Explanation Indicator 6 FFY Data in the Annual Performance Report (APR) Data years presented will reflect the data NYSED submits to the federal Office of Special Education Programs (OSEP) in the APR which covers the federal fiscal year (FFY) period The Indicator 6 data sample is collected on a point in time basis The FFY 2020 APR is submitted to OSEP October 2020 FFY 2020 APR February 2022 The October 2020 Preschool LRE Data is included in the FFY 2020 APR 13 FFY Data Explanation
New York State SPP 2013-19 Targets and Actuals Indicator 6A: Regular Early Childhood Program 52% +3.00 0.00 50% Increase = Improvement 48% +2.00 46% +1.50 0.00 +0.15 +0.60 +1.47 44% -0.50 -0.86 -1.25 +0.27 42% 40% 2013 42.90% 42.92% 2014 43.50% 43.19% 2015 43.50% 41.94% 2016 45.00% 43.41% 2017 47.00% 43.56% 2018 50.00% 43.06% 2019 50.00% 42.20% 6A: NYS Target 6A: NYS Result Difference -1.56 -1.59 -3.44 -6.94 -7.80 +.02 -.31 14 Indicator 6A: SPP 2015-19 Actual Reported Data
7-PAK States Results Comparison Indicator 6A: Regular Early Childhood Program 80% 70% Increase = Improvement 60% 50% 40% 30% 20% 10% 0% New York California Florida Pennsylvania Illinois Texas Ohio 2015 2016 2017 2018 2018 National Mean 50% 15 6A: State Comparison Reported Data from the APR
New York State SPP 2013-19 Targets and Actuals Indicator 6B: Separate Class, School or Facility 25% +1.21 0.00 24% +0.82 -0.03 Decrease = Improvement -1.12 -1.18 23% -0.22 -1.77 22% -1.00 21% -1.00 20% -1.00 19% -1.00 0.00 18% 17% 2013 23.77% 23.77% 2014 22.00% 22.65% 2015 21.00% 23.86% 2016 20.00% 22.68% 2017 19.00% 22.46% 2018 18.00% 23.28% 2019 18.00% 23.25% 6B: NYS Target 6B: NYS Result Difference -2.86 -2.68 -3.46 -5.28 -5.25 0 -.65 16 Indicator 6B: SPP 2015-19 Actual Reported Data
7-PAK States Results Comparison Indicator 6B: Separate Class Setting 50% 45% 40% Decrease = Improvement 35% 30% 25% 20% 15% 10% New York California Florida Pennsylvania Illinois Texas Ohio 2015 2016 2017 2018 2018 National Mean 20% 17 6B: State Comparison Reported Data from the APR
6A Regular Early Childhood Program: Old vs New Measurement Target Increase = Improvement Old Measurement (includes 5-year-olds in Kindergarten) New Measurement (excludes 5-year-olds in Kindergarten) 18 6A: Old (Reported Data) vs. New (Equated Data) Measurement Comparison
6B Separate Class Setting: Old vs New Measurement Target Decrease = Improvement Old Measurement (includes 5-year-olds in Kindergarten) New Measurement (excludes 5-year-olds in Kindergarten) 19 6A: Old vs. New Measurement Comparison
Past Trend and State/National Comparison Data 1) What did the Indicator 6 Statewide SPP data tell us? 2) How should we use the data to inform our target-setting and improvement activities? Stakeholder Discussion 20 Stakeholder Question
Indicator 6 Disaggregated Data in NYS Consideration of data by Race & Ethnicity, School District Needs Resource Capacity and County Region
Indicator 6A: Regular Class Setting Student Data by Race and Ethnicity (FFY 2019) 6A: Regular Class 50% Target Increase = Improvement Native Hawaiian/ Other Pacific Islander (Student Count = 28) 57.1% Did Not Meet Target Met Target Multiracial 47.7% (Student Count = 833) Hispanic or Latino (Student Count = 4,305) 35.1% Black or African American (Student Count = 2,126) 36.9% Asian 40.8% (Student Count = 1,045) American Indian or Alaska Native (Student Count = 74) 24.2% White 44.9% (Student Count = 11,144) 0.0% 10.0% 20.0% 30.0% 40.0% 50.0% 60.0% 22 2019 Data Equated to the New 2020 Measurement with FFY 2019 Target
Indicator 6A: Regular Class Setting Needs/Resource Capacity FFY 2019 6A: Regular Class 50% Target Increase = Improvement LOW NEEDS 36.5% AVERAGE NEEDS 40.4% RURAL HIGH NEEDS 35.6% URBAN/SUBURBAN/ HIGH NEEDS 33.2% LARGE CITY 41.9% NEW YORK CITY 45.8% 0.0% 20.0% 40.0% 60.0% 23 2019 Data Equated to the New 2020 Measurement with FFY 2019 Targets
Regional 6A Data Majority of services in a regular early childhood program County Level Data Met Target Did not Meet Target (Within 25%) Did not Meet Target (Over 25%) Minimum Value 50.0% 37.5% 0.0% Maximum Value 100.0% 49.9% 37.4% 24 2019 Reported Data Equated to the 2020 Measurement Compared to the 2019 APR Target School District Data by County
6A Disaggregate Data 1) What did the Indicator 6A disaggregate SPP data tell us? 2) How should we use the data to inform our target-setting and improvement activities? Stakeholder Discussion 25 Stakeholder Question
Indicator 6B: Separate Class Setting Student Data by Race and Ethnicity (FFY 2019) 6B: Separate Class 18 % Target Decrease = Improvement Native Hawaiian/ Other Pacific Islander (Student Count = 11) No Cohort Met Target 22.4% Multiracial 23.5% (Student Count = 411) Hispanic or Latino (Student Count = 5,166) 42.1% Black or African American (Student Count = 2,588) 44.9% Asian 41.5% (Student Count = 1,062) American Indian or Alaska Native (Student Count = 146) 47.7% White 20.3% (Student Count = 5,042) 0.0% 5.0% 10.0% 15.0% 20.0% 25.0% 30.0% 35.0% 40.0% 45.0% 50.0% 26 2019 Data Equated to the New 2020 Measurement with FFY 2019 Target
Indicator 6B: Separate Class Setting Needs/Resource Capacity (FFY 2019) Decrease = Improvement 6B: Separate Class 18 % Target LOW NEEDS 22.5% AVERAGE NEEDS 18.9% RURAL HIGH NEEDS 10.4% URBAN/SUBURBAN/ HIGH NEEDS 28.2% LARGE CITY 22.4% NEW YORK CITY 45.8% 0.0% 10.0% 20.0% 30.0% 40.0% 50.0% 60.0% 27 2019 Data Equated to the New 2020 Measurement with FFY 2019 Targets
Regional 6B Data Separate special education class, separate school or residential facility County Level Data Met Target Did not Meet Target (Within 25%) Did not Meet Target (Over 25%) Minimum Value 0% 18.1% 22.6% Maximum Value 18% 22.5% 100.0% 28 2019 Reported Data Equated to the 2020 Measurement Compared to the 2019 APR Target
6B Disaggregate Data 1) What did the Indicator 6B disaggregate SPP data tell us? 2) How should we use the data to inform our target-setting and improvement activities? Stakeholder Discussion 29 Stakeholder Question
Indicator 6C: Home Setting Student Data by Race and Ethnicity (FFY 2019) Decrease = Improvement Native Hawaiian/ Other Pacific Islander (Student Count = >=5) 4.1% Multiracial 6.9% (Student Count = 120) Hispanic or Latino (Student Count = 852) 6.9% Black or African American (Student Count = 227) 3.9% Asian 4.2% (Student Count = 107) American Indian or Alaska Native (Student Count = 20) 6.5% White 10.1% (Student Count = 2,519) 0.0% 2.0% 4.0% 6.0% 8.0% 10.0% 12.0% 30 2019 Data Equated to the New 2020 Measurement
Indicator 6C: Home Setting Needs/Resource Capacity FFY 2019 Decrease = Improvement LOW NEEDS 6.1% AVERAGE NEEDS 13.8% RURAL HIGH NEEDS 19.4% URBAN/SUBURBAN/ HIGH NEEDS 13.1% LARGE CITY 12.1% NEW YORK CITY 1.2% 0.0% 20.0% 31 2019 Data Equated to the New 2020 Measurement with FFY 2019 Targets
2020 Regional 6C Data Receiving special education and related services in the home 11.3% aggregate statewide average performance in 2020 County Level Data Met Baseline Did Not Meet Baseline (Within 25%) Did Not Meet Baseline (Over 25%) Minimum Value 0% 11.31% 14.08% Maximum Value 11.30% 14.07% 100% 32 2o20 Reported Data Compared to the 2020 Baseline
6C Disaggregate Data 1) What did the Indicator 6C disaggregate SPP data tell us? 2) How should we use the data to inform our target-setting and improvement activities? Stakeholder Discussion 33 Stakeholder Question
State Performance Plan (SPP)/ Annual Performance Report (APR) 2020-2025 Individuals with Disabilities Education Act (IDEA) Indicator 6 Improvement Strategies
Inclusive Programs and Activities is a Priority Area Photo of the blueprint for Improved Results for Students with Disabilities Providing high quality inclusive programs and activities is one of seven core principles and practices supported by research for all students with disabilities as part of New York State s Blueprint for Improved Results for Students with Disabilities 35 Blueprint for Improved Results for Students with Disabilities (nysed.gov)
LRE Guidance from the Office of Special Education The Office of Special Education published guidance on Individualized Education Program (IEP) development and School District Responsibilities to Provide Students with Disabilities with Specially- Designed Instruction and Related Services in the Least Restrictive Environment (LRE) 36 OSE LRE Guidance: IEP Development and District LRE Responsibilities
Promoting Preschool Inclusion in PreK Programs Joint guidance was issued in July 2021 titled School District Responsibilities for Preschool Inclusion in Publicly Funded Prekindergarten (PreK) Programs. This guidance outlines that publicly funded PreK programs must be leveraged to meet preschool least restrictive environment responsibilities and ensure meaningful preschool inclusion. NYSED plans to support school districts in implementing blended funding and dual enrollment models in publicly funded PreK programs by issuing future guidance based on questions from the field. Questions may be submitted to SPECED@nysed.gov NYSED guidance on School District Responsibilities for Preschool Inclusion OSE LRE Guidance: Inclusion in UPK
Early Childhood Cross-System Collaboration Partnership with the New York State Council on Children and Families on the New York State Birth Five Renewal Grant to enhance coordination and more efficiently provide access to high quality, equitable and comprehensive early care and learning environments and services essential for healthy development. How to Guide for Blending and Braiding Funds was issued to assist early childhood program providers in navigating reimbursement options including integrated general and special education services. OSE participation in the Early Childhood Advisory Council (ECAC) which provides strategic direction and advice to the State of New York on early childhood issues. 38 New York State Early Childhood Cross-System Collaboration
NYCDOE Preschool Inclusion Efforts The New York City Department of Education (NYCDOE) is implementing a comprehensive plan to promote preschool inclusion. As part of the NYCDOE inclusion plan, more preschool students with disabilities will receive the majority of their services in a regular early childhood classroom and the number of preschool students receiving services in a special class program will be reduced. 39 NYCDOE Inclusion Efforts
Office of Special Education Educational Partnership Tiered Support & Professional Development Systems Change Work Providing a Variety of Supports to Educational Organizations in New York State 12 Regional Partnership Centers 1 Regional Learning 14 School-Age Family and Community Engagement Centers 2 Targeted Skills/Support Groups 14 Early Childhood Family and Community Engagement Centers 3 Support Plans 40 Office of Special Education Educational Partnership
Educational Partnership Resources Targeted Professional Development Improvement Strategies Educational Partnership Trainings impacting Preschool LRE include, but are not limited to: Classroom Management Training CPSE/CSE Chairperson Training Creating the Individualized Education Program Functional Behavioral Assessment (FBA)/Behavioral Intervention Plan (BIP) Toolkit Using the FBA/BIP Process to Support Students Needing Intensive Interventions Function Based Thinking in Preschool Introduction to the Behavior Pathways Specially Designed Instruction Series Positive Behavior Interventions and Supports Tier 1 & Tier 2 Team Training Positive Solutions for Families: Pyramid Model Preschool Special Education Process Using the Competing Behavior Pathway to Identify Interventions 41 OSE Educational Partnership Resources
Potential New Improvement Strategies#1-#3 Amend New York State law to deem school districts approved to provide preschool Special Education Itinerant Services (SEIS) and Special Class in an Integrated Setting (SCIS) program services without separate NYSED approval. 1 Require districts to review their Indicator 6 data in aggregate and also by race and ethnicity. For districts not meeting Indicator 6 targets, or if a disparity is 2 Local District Preschool Inclusion Self-Assessment found in the race and ethnicity data, districts would be required to complete a Local District Preschool Inclusion Self-Assessment. Create a targeted monitoring activity to review and document Committee on Preschool Special Education decision-making processes pertaining to preschool inclusion. Include documentation that the parent was informed of their child s rights to receive services in the least restrictive environment. 3 42
Potential New Improvement Strategies #4-#7 Streamline the existing regional need process to identify need for SEIS and SCIS programs in counties based on districts' Indicator 6 data. 4 Streamline the existing regional need process to identify need based on a school district s endorsement of an inclusive PreK program for dually enrolled resident students. 5 Issue a moratorium on special class expansions where least restrictive environment targets are not being met. 6 7 Supplement existing guidance with additional information for blending and braiding district PreK and county preschool special education funding. 43
Potential New Improvement Strategies #8-#9 Amend regulation to expand the preschool continuum in New York State to include more flexible models for preschool special education delivery in the regular early childhood program environment. 8 Create a parent resource to describe the benefits of preschool inclusion and outline their child's right to receive preschool special education programs and related services in the least restrictive environment. 9 44
What activities could be considered, maintained, or strengthened to addressimprovements in preschool least restrictive environment? Stakeholder Question
State Performance Plan (SPP)/ Annual Performance Report (APR) 2020-2025 Individuals with Disabilities Education Act (IDEA) Indicator 6 Preschool Least Restrictive Environment Target Setting
Target Setting Recommendation for Indicator 6 Inclusive Targets vs. Individual Targets
NYSED is Recommending One Target Inclusive of Children Ages 3, 4, and 5 for Indicator 6 States may choose to set one target that is inclusive of children ages 3, 4, and 5, or set individual targets for each age. NYSED proposes to NOT establish individual targets due to the small sample size for Age 5. NYSED recommends Indicator 6 targets inclusive of children ages 3, 4, and 5. Age 5 Student Count 2015-16 Age 5 Student Count 2016-17 Age 5 Student Count 2017-18 Age 5 Student Count 2018-19 Age 5 Student Count 2019-20 % % % % % Setting Type 2015-16 2016-17 2017-18 2018-19 2019-20 A. Regular early childhood program <=5 12.1 <=5 17.2 <=5 14.3 <=5 22.2 <=5 41.7 B. Separate class, school or residential facility <=5 9.1 <=5 17.2 <=5 14.3 <=5 11.1 <=5 8.3 C. Receiving special education and related services in the home <=5 <=5 <=5 <=5 0% <=5 3.4 0% 0% 0% 48 Target Recommendation for Indicator 6 Target Inclusive of Children Ages 3,4, and 5
Do you agree with NYSEDs recommendation to set Indicator 6 targets inclusive of children ages 3, 4, and 5? Stakeholder Question
Target Setting Recommendation for Indicator 6 Baseline and 2020-2025 Proposed Targets