Sustainable Livestock and Future Generations
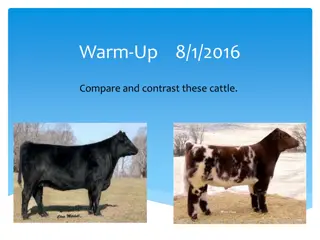
Sustainable development aims to meet present needs without compromising the ability of future generations to meet their own. Cooperation and responsible resource management, particularly in livestock farming, play crucial roles in ensuring a balanced ecosystem and socio-economic prosperity. The concept of the doughnut model emphasizes the importance of staying within the planetary boundaries for a safe and just environment. Livestock production offers multiple benefits, including economic and social services, environmental preservation, and resource sustainability.

Download Presentation

Please find below an Image/Link to download the presentation.
The content on the website is provided AS IS for your information and personal use only. It may not be sold, licensed, or shared on other websites without obtaining consent from the author. Download presentation by click this link. If you encounter any issues during the download, it is possible that the publisher has removed the file from their server.
E N D
Presentation Transcript
Multiple Benefits from Sustainable Multiple Benefits from Sustainable Livestock Livestock Henning Steinfeld, FAO 7th Multi 7th Multi- -Stakeholder Partnership Stakeholder Partnership Meeting Addis Ababa, Ethiopia, 8th May 2017 Meeting
Sustainable development is development that meets the Sustainable development is development that meets the needs of the present without compromising the ability of needs of the present without compromising the ability of future generations to meet their own needs. future generations to meet their own needs. Brundtland Report, 1987 Millennium Development Goals 2000 to 2015 2015 to 2030
Cooperating with the future Cooperating with the future Overexploitation of renewable resources today has a high cost on the welfare of future generations % units extract < T Defectors The voting institution is robust to extreme decision-makers and thereby increases cooperative behavior % units extract > T Generation 1 5 players Common pool of 100 units Each player can extract 0 to 20 units Cooperators Hauser et al., 2014
Meeting Meeting the needs of all within the means of the the needs of all within the means of the planet planet Raworth, 2017
Ecologically Ecologically safe and socially just space safe and socially just space The inner ring of the doughnut represents a sufficiency of the resources we need to lead a good life: food, clean water, housing, sanitation, energy, education, healthcare, democracy. Anyone living within that ring, in the hole in the middle of the doughnut, is in a state of deprivation. The outer ring of the doughnut consists of the Earth s environmental limits, beyond which we inflict dangerous levels of climate change, ozone depletion, water pollution, loss of species and other assaults on the living world. Raworth, 2017
LIVESTOCK AND THE INTERPLAY OF BIO-PHYSICAL (NATURE) AND SOCIO-ECONOMIC (HUMAN) DIMENSIONS RESOURCE POOL HUMAN BENEFITS LIVESTOCK PRODUCTS NATURAL RESOURCES CLIMATE CHANGE DEMAND GROWTH Food Manure Fuel Draft power Leather Fiber Land Water Genetic resources Nutrients Energy Livestock ECONOMIC and SOCIAL SERVICES ENVIRONMENTAL SERVICES Growth Poverty reduction Employment Health and nutrition Equity Landscape Political stability Climate Nutrient cycling Biodiversity conservation Water cycles Environmental Health COMPETITION & SCARCITY
Bio Bio- -physical dimension physical dimension Energy capture, photosynthesis, fuels (fossil, biofuels) 65,000 TW reaches the hydrosphere, but less than 1% is converted to NPP The food sector currently accounts for 30% of the world s total energy consumption (FAO, 2011) Livestock energy conversion typically ranges from 1.0 to 4.3 MJ of fossil fuel per MJ of animal product (Giampietro, 2002) Land use Livestock systems occupy 29% of the global surface area 3.3 billion hectares for rangelands; 25% of total land area 0.5 billion hectares of the crop land area is being used for feed production; 4% of the total land area Biodiversity 75% of the world s food supply is generated from only 12 plants and five animal species Livestock have direct impacts on biodiversity through trampling, grazing, and defecation, the larger indirect impacts - through deforestation, GHG emissions, feed trading, and water pollution (Reid et al, 2009) Water About 70% (2769 km3/year)of fresh water is used for agriculture (AQUASTAT, 2016) Water use for livestock represents31% of the total agriculture water use (de Fraiture et al., 2007)
Bio Bio- -physical dimension physical dimension Nutrients Livestock is an important source of soil nutrients, where reliance on fertilizer is low, like in Sub- Saharan Africa (Goulding et al., 2008; Rufino et all., 2006) Nutrient use efficiency (NUE) for Nitrogen ranges from 27-48% for the livestock supply chain in Europe (Uwizeye et al., 2016), and from 46-121% in crop-livestock systems in Africa (Rufino et al., 2006) Climate change Livestock supply chains emitted 8.1 gigatonnes CO2-eq in 2010 (GLEAM 2007 Version 2.0) Livestock production in Sub-Saharan Africa represents 5% of the total global sector s emission (GLEAM 2007 Version 2.0) Emission intensity of dairy systems in Ethiopia is on average 24.5 Kg CO2 eq./kg FPCM, and ranges from 3.8 to 44.6 Kg CO2 eq./kg across dairy production systems (FAO & NZA Greenhouse Gas Research Centre, 2017) Diseases Current emerging infectious diseases are associated with human modification of the environment Animal diseases generate a wide range of biophysical and socio-economic impacts that may be both direct and indirect, and may vary from localized to global (Perry & Sones 2009) Biomass production Humans appropriate 25% of the total net primary production (HANPP) (Krausmann et al., 2013) Agriculture represents 84 86% of total appropriation of HANNP, with 42 46% on cropland and 29 33% on grazing land (Krausmann et al., 2013). HANPP in Sub-Sarahan Africa is around 18% (Haberl et al., 2007)
Socio Socio- -economic dimension economic dimension Food and Nutrition All the world s population, i.e. 7.4 billion people consume food every day. 793 million people are undernourished, 1.9 billion people are overweight, of which 600 million obese adults (WHO) Livestock products contribute 17% to global calorie consumption and 33% to protein consumption globally 23% of Sub-Saharan population is undernourished (FAO, 2016). In Ethiopia, 32% of the population is undernourished (FAO, 2016) and 16.8% is overweight (WHO, 2014) Value, income and employment Agriculture (primary production) contributes $5.2 trillion or 6% to world s GDP Livestock global asset is valued at least $3.1 trillion Livestock supply chain employ at least 1.3 billion people globally and directly support the livelihoods of 600 million poor smallholder farmers In Ethiopia, the dairy sector represents 40% of agricultural GDP and 12 16% in the national GDP There are about 11.4 million livestock producing households in Ethiopia (CSA, 2013)
Socio Socio- -economic dimension economic dimension Rural growth and linkages, political stability Agricultural growth has multiplier effects, and raises income by factor 1. 7 to 2.7 in Africa and Asia (Pinstrup Andersen and Watson, 2011). Increases in international food prices can lead to unrest and conflict, e.g. Arab spring (Arezki and Markus Br ckner, 2011) Environmental services and cultural values Tourism, landscape aesthetics Food as part of culture and social interaction
Outside pressures (external drivers) Outside pressures (external drivers) Demand growth Population growth 2015/2050: World: 7.3 to 9.7 billion (+32%); SSA: 1.0 to 2.2 billion (+120%); Ethiopia: 99.4 to 188.5 million (+90% ) Changing diets Ethiopia s milk consumption is 19 liters per person per year. In urban areas, as in Addis Ababa, milk per capita consumption is currently 52 liters (FAO & NZA Greenhouse Gas Research Centre, 2017) Urbanization 2015/2050: World: 54 to 65%; SSA: 37 to 53%; Ethiopia: 19 to 37% Climate change Increase in temperature and CO2 level Climate variability extreme events (droughts, floods) New disease threats Competition and scarcity Competiton for land, water, energy Growing scarcity (water depletion, land degradation, phosphorus, energy)
Ways of describing the interplay Matter flows: LCA Values flows: value chain analysis Pathogen flows: disease transmission
The interplay between bio The interplay between bio- -physical and socio physical and socio- -economic dimensions economic dimensions Matter transformation: Life Cycle Assessment of Livestock Supply Chain Land, water, feeds Protein and calories Transformation (production & processing) Use & Resources Consumption Nutrients Nutrients & waste
The interplay between bio The interplay between bio- -physical and socio physical and socio- -economic dimensions economic dimensions Value Chain: Livestock Supply Chain Transformation (production & processing) Use & Resources Consumption $ $ Benefits (value) is generated and distributed at each step
The interplay between bio The interplay between bio- -physical and socio physical and socio- -economic dimensions economic dimensions Health: Livestock Supply Chain Transformation (production & processing) Use & Resources Consumption Interactions involving different organisms (plants, animals, fungi, bacteria, and pathogens) in all stages
The interplay between bio The interplay between bio- -physical and socio Matter transformation: Nitrogen use in the livestock supply chain physical and socio- -economic dimensions economic dimensions The Life-Cycle Nutrient Use Efficiency (NUE) for Nitrogen ranges from 27- 48% for the livestock supply chain in Europe (Uwizeye et al., 2016) NUE at animal level ranges from 15 to 35%, while farm and system level NUE ranges from 15 to 55% (Gerber et al., 2014) System boundary and nutrients flows in livestock supply chains (Uwizeye et al., 2016)
The interplay between bio The interplay between bio- -physical and socio Value chains physical and socio- -economic dimensions economic dimensions New Zealand Dairy Value Chain Traditional Milk Marketing Channel in Bangladesh From the farmers in New Zealand to customers in over 140 countries Export Local Shipping and wholesale distribution Cooperatives/ Suppliers consumer/ Tea stall Milk is manufactured in more than 50 sites in NZ and other countries Branding and marketing Commodity flow 5% 4% Flow of value Dairy farmer Food manufacturing (ingredients) 95% of the milk is exported 76% Processing Household consumption: 15% Cooperatives Gowala (middlemen) Gowala earn a major share of the profit from unorganized milk market system NZ produces 4% of world s milk Dairy farmer
Pathway map of AMA and AMR dissemination within agriculture, the environment, and the food processing industry. Sophie Thanner et al. mBio 2016; doi:10.1128/mBio.02227-15
The interplay between bio The interplay between bio- -physical and socio physical and socio- -economic dimensions economic dimensions Spatial dimension: Soybean expansion in Brazil Brazil produced 95.5 million metric tons of soybeans in 2015/2016 China imported 45% of total Brazilian soybean production China soybean imports represents: Financial flow: 16.4 bi US$ Land use area: 10,421,011 ha Potential territorial deforestation area: 866,564 ha Source: Trase, 2015
The interplay between bio The interplay between bio- -physical and socio physical and socio- -economic dimensions economic dimensions Temporal dimension: environmental impact time-lag Long-term effect of N fertilization GHG lifetime in the atmosphere Greenhouse Gas Lifetime in the atmosphere (years) Groundwater time-of-travel estimates and tritium data both suggest that groundwater remains resident in these watersheds for more than 30 years, therefore changes in agricultural practices may take decades to fully affect improvements in groundwater quality (Tomer and Burkart, 2002) Carbon dioxide 50-200 Methane 12 Nitrous oxide 120 CFC-12 100 CFC-11 45
PRINCIPLES OF SUSTAINABLE FOOD AND AGRICULTURE NATURAL SYSTEM HUMAN SYSTEM LIVESTOCK PRODUCTS NATURAL RESOURCES Land Water Genetic resources Nutrients Energy ECONOMIC and SOCIAL SERVICES Food Manure Fuel Draft power Leather Fiber ENVIRONMENTAL SERVICES LIVESTOCK Growth Poverty reduction Employment Health and nutrition Equity Landscape Political stability Climate Nutrient cycling Biodiversity conservation Oceans and water cycles Environmental health Increase resource-use efficiency SUSTAINABILITY Protect, and enhance critical resources Balance human needs PRINCIPLES Manage Risks and build resilience Develop governance and institutions
SFA Approach SFA Approach - - Five Principles Five Principles Improve efficiency of resources Protect critical resource Enhance human benefits Manage risks and build resilience Develop governance and institutions
Figure 1. Three dimensional parameter-space showing the interplay between land (green), labour (blue) and capital (red). The extreme high values of each accompanied by low values of the other two are indicated as the corners of a triangle. land Agri-food system transition Extensive Medium- scale commercial Subsistence Industrial labour capital labour capital
Figure 2. False colour composite image representing each dimension, equally scaled on a different coloured gun. Land (green) is proxied by length of growing period; labour (blue) by rural population density and and capital (red) by night-time lights (see text). Version 02: Red: by night-time lights Green:: length of growing period; Blue: Marius s new Ag pop at 10k land Land Lo Labour Lo Capital Lo Colour Black Hi Lo Lo Lo Hi Lo Lo Lo Hi Green Blue Red Lo Hi Hi Hi Hi Lo Hi Lo Hi Magenta Cyan Yellow NB orange is created by: R) Capital = HIGH G) Land = MEDIUM B) Labour = LOW capital labour Hi Hi Hi White
Resource efficiency Resource efficiency Extensive Systems efficiency in providing multiple benefits; focus on eco-systems services, often through mobility Labour Intensive efficiency in land use and non-tradables, often through diversification Capital Intensive efficiency in use of external inputs, integration through commercial linkages
Protect and Enhance Critical Resources Protect and Enhance Critical Resources Extensive Systems: focus on resource integrity of unmanaged (or lightly managed) environments Labour Intensive: maintain resource productivity (prevent degradation, restore fertility, circular economy (on farm) Capital Intensive: prevent pollution and over-exploitation (water), circular economy within landscape
Balance human benefits Balance human benefits Extensive systems: maintain rights of indigenous/traditional users; provide alternatives where necessary Labour Intensive: optimize food security, income, employment for low-income populations, reduce losses and disease pressure Capital Intensive: avoid overconsumption and food waste, focus on urban consumption; food safety
Manage Risks and Resilience Manage Risks and Resilience Exposure, sensitivity and adaptive capacity Extensive Systems: very exposed to natural risks/climate variation; adaptation through mobility and exits Labour Intensive: exposed to disease risks and climate shocks; adaptation through diversification Exposed to over-exploitation and resource pressure; adaptation through resource restoration and exits, collective action Capital Intensive: exposed to market risks and disease; adaptation through insurance schemes and changes in business models
Governance and institutions Governance and institutions Through policy dialogue, multi-stakeholder consultation and regulatory frameworks Extensive Systems: Regulate access to common property resources: land, water, biodiversity; provide payment for environmental services; social protection Labour Intensive: encourage collective action to address high transaction costs; ensure access to critical natural resources (water, grazing land) Capital Intensive: Address negative environmental and health externalities (regulations, fees)
Multiple Benefits from Integration Multiple Benefits from Integration Integrated approach Integration of Stakeholders (Global Agenda): Dialogue Consensus Joint Action Integration of Objectives enhance multiple benefit, reduce trade-offs Integration of Technical Domains and Scientific Approaches Bio-physical transformation - LCA Value generation and distribution values chain analysis Human health, animal health, environmental health One Health From Maximization to Optimization
Conclusions Conclusions FA major driver of environmental change large interface with common property resources FA provide more human benefits than just GDP income, employment, culture, social life and cohesion Diversity of systems and interactions; private goods and common resources Sustainability: Multiple objectives, changing over time integrated tools for multiple benefits collaborating with the future
Thank you henning.steinfeld@fao.org


 AND")


")