Essential Principles of Clinical Trials and Study Designs
Exploring a comprehensive schedule covering topics such as specimen appraisal, diagnostic tests, meta-analysis, and observational studies like case-control and cohort. Delve into the significance of exposure, outcome, and time in different study designs, including intervention studies and reliability/validity assessment.

Download Presentation

Please find below an Image/Link to download the presentation.
The content on the website is provided AS IS for your information and personal use only. It may not be sold, licensed, or shared on other websites without obtaining consent from the author. Download presentation by click this link. If you encounter any issues during the download, it is possible that the publisher has removed the file from their server.
E N D
Presentation Transcript
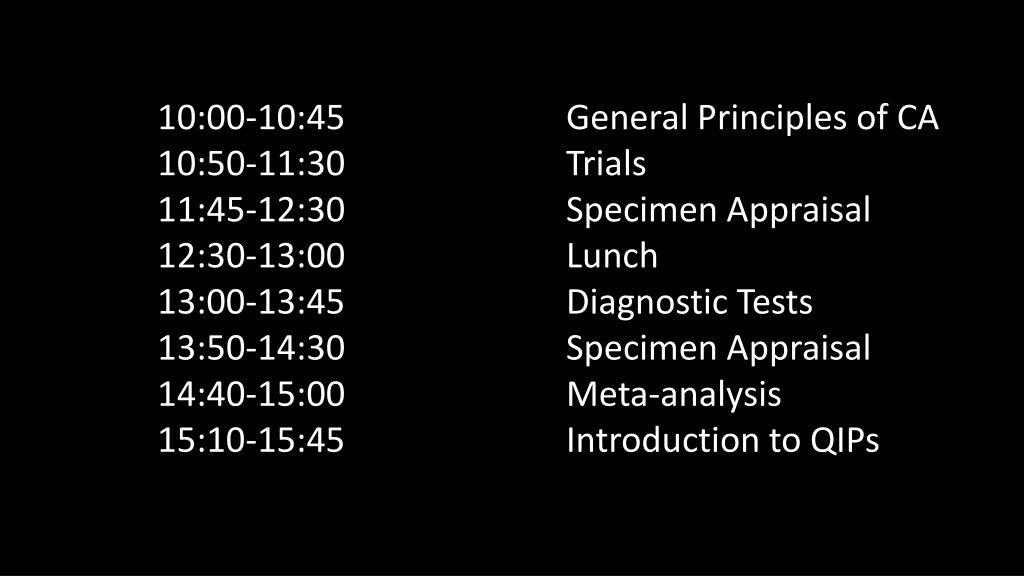
10:00-10:45 10:50-11:30 11:45-12:30 12:30-13:00 13:00-13:45 13:50-14:30 14:40-15:00 15:10-15:45 General Principles of CA Trials Specimen Appraisal Lunch Diagnostic Tests Specimen Appraisal Meta-analysis Introduction to QIPs
Principles of Critical Appraisal Adrian Boyle MD FCEM
Aims and objectives What explains a study finding The top five
Observational studies Case-control Cohort Cross-sectional Think in terms of Time, Outcome, Exposure and Population
COHORT STUDIES Exposure ?Outcome No Exposure ?Outcome Time
CASE CONTROL STUDIES Outcome ? Exposure No Outcome ? Exposure Time
Cross-Sectional design Outcome ? Exposure No Outcome ? Exposure
Mystery Study Design ?Outcome Exposure ?Outcome No Exposure Time
Other observational studies Ecological studies Migrant studies Case series Case reports
Intervention studies Exposure status of the subject is assigned by the investigator Randomisation and blinding
Reliability and Validity Reliability Validity = = Repeatibility Relationship to truth
Validity High Low High Measured value Reliability Low
The traditional hierarchy Meta-analysis and Systematic reviews RCTs with significant results RCTs without significant results Cohort studies Case control studies Cross-sectional studies Case reports and series
Actual Study To evaluate the role of hard contact lens as a risk factor for keratoconus, 162 keratoconus patients were compared to 1248 individuals who wore soft contact lens The soft group was observed over six years. The authors found that 26.5% of the keratoconus patients wore hard contact lens before diagnosis and only one soft patient developed keratoconus
Actual Study The authors conclude that hard contact lens use is associated with keratoconus What study design is used? Do you agree with the authors?
Actual Study This study is not comparing the rate of exposure among cases and controls (Case control) This study is not comparing the rate of outcome among exposed and non-exposed (Cohort) This is uninterpretable
The Big Five Bias Confounding Chance Fraud Causality
Point of statistics Evaluate role of chance How likely is it that this result could have occurred by chance? Quantify effect How many of my patients will get better if I give them this treatment? Adjust for multiple confounders Regression analysis
Chance Power What is the chance of detecting a difference if one truly existed 95% Confidence Intervals Larger studies have less random error around the estimate Increased Precision Preferable to p-values as confirm both a hypothesis and indicate precision
95% Confidence Intervals CRASH 2 Relative Risk 0 91, 95% CI 0 85 0 97; p=0 0035 3CPO Relative Risk 0.85, 95% CI 0.82-1.03, p= 0.056 Relative Risk 0.89, 95% CI 0.02-10.5, p= 0.23
Confidence Interval of the difference Measure the difference between two means and estimate the precision of that difference The difference between the two groups was 10 (95% CI 8-12)
Confounding A variable that is associated with both the exposure and the outcome of interest Smoking Cirrhosis
Confounding A variable that is associated with both the exposure and the outcome of interest Boozer Smoking Cirrhosis
Adjusting for multiple confounders Outcome Exposure
Aim of regression analysis https://encrypted-tbn1.gstatic.com/images?q=tbn:ANd9GcR6ZhkayeBtzTC45JV89dPMyDODDabSiHTuVhOJkfGM1K1HC0Lm Outcome Exposure
Bias A systematic distortion of the attributes of the population, exposure or outcome that undermines the validity of the findings E.g response bias, a postal survey of 1000 patients one week after discharge from ITU found that all were very pleased with their care, response rate of 20%
Fraud Harder to detect Look for conflicts of interest Be wary of commercially sponsored trials in highly selected patients Be wary of the pretty woman bearing muffins Seeding studies
Causality Some interventions do work How do you know whether an association is causal? Try to decide whether they work with your patients
Causal? Bradford Hill Criteria Strong association Consistent across study designs Plausible Temporal Specific Biological gradient Coherence Experimental evidence RCT Analogy
Measures of effect Relative risk reduction incidence in exposed incidence in non exposed Absolute risk reduction incidence in exposed incidence in non- exposed
Number Needed to Treat / Harm Inverse of the absolute risk reduction Randomised controlled trial of asprin and thrombolysis versus nothing for MIs, outcome death at 7 days
Results : relative risk Intervention No Intervention 16% Died 20% Died What is the relative risk reduction ?
Results : relative risk Intervention No Intervention 16% Died 20% Died Relative risk reduction is 0.16/ 0.2 0.8
Results : absolute risk Intervention No Intervention 16% Died 20% Died What is the absolute risk reduction and the Number Needed To Treat?
Results : absolute risk Intervention No Intervention 16% Died 20% Died Absolute risk reduction is 0.2 0.16 0.04
Number needed to treat 1/ 0.04 = 25
Sources of bias Selection Performance Losses to follow up Detection
What bias is there here? Population 200 Randomisation Exposure 1 Exposure 2 100 100 15 Outcome Outcome 12 10
Is this bias? Population 2000 Randomisation Exposure1 Exposure 2 100 100 Outcome 10 Outcome 50
What bias is there here? Population 200 Randomisation Exposure1 Exposure 2 100 100 No No Outcome 10 Outcome Outcome 60 Outcome 80 20
Outcome measure Does the outcome mean anything to you? Beware surrogate outcomes Beware composite outcome especially if industry funded
Conclusions Critical appraisal is not hard Identify the study design Consider the five reasons for any observed finding in study Practice