Meta-Analysis of Convention Satisfaction and Loyalty Trends
This meta-analysis explores the relationship between attributes, perceptions, satisfaction, and loyalty in the convention industry. It highlights key findings from multiple studies using statistical methods to analyze attendee satisfaction and loyalty factors. The study emphasizes the importance of factors such as networking, education, convention environment, destination image, service quality, and more in influencing attendee loyalty.

Download Presentation

Please find below an Image/Link to download the presentation.
The content on the website is provided AS IS for your information and personal use only. It may not be sold, licensed, or shared on other websites without obtaining consent from the author. Download presentation by click this link. If you encounter any issues during the download, it is possible that the publisher has removed the file from their server.
E N D
Presentation Transcript
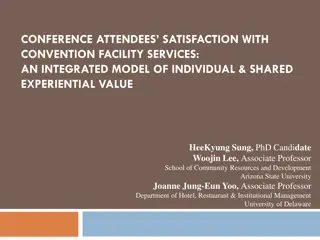
A META-ANALYSIS OF CONVENTION SATISFACTION AND LOYALTY SHINYONG (SHAWN) JUNG, MBA, shinyong.jung@unlv.edu SARAH TANFORD, PH.D. sarah.tanford@unlv.edu
INTRODUCTION With its significant economic contribution and other positive impacts overall, the convention industry has focused on the factors that influence attendees satisfaction to generate repeat attendance, which is loyalty. However, a consolidated review of research exploring the attributes and perceptions that have an impact on attendee satisfaction and loyalty is lacking. To fill this gap, a meta-analysis of convention journal articles was conducted.
CONCEPTUAL MODEL (FIGURE 1) Attributes Satisfaction Perceptions Loyalty
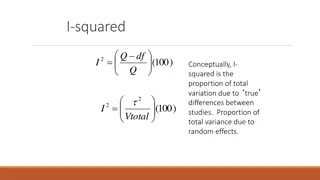
META-ANALYSIS Meta-analysis is a statistical method that synthesizes key research findings from multiple studies (Glass, 1976). It evaluates effect sizes across an entire data set, enabling researchers to compare the relative magnitude of relationships between different variables.
METHOD Since most of the studies use regression-based techniques, correlations are the appropriate effect size for analysis. Following accepted meta-analysis procedures (Borenstein, Hedges, Higgins, & Rothstein, 2009), correlations were coded for every relationship illustrated in Figure 1. After the coding process was completed, the statistical analysis was conducted using Comprehensive Meta-Analysis version 3 (CMA) software.
ATTRIBUTES-SATISFACTION Number of effects Total N Summary effect size Lower bound Upper bound Fail-safe N p .600 .000 4 1255 .380 .756 28 Networking .520 .000 8 1655 .308 .683 43 Education Convention environment .372 .000 9 2183 .261 .474 27 Destination image .125 .485 5 1305 -.223 .444 5
ATTRIBUTES-LOYALTY Number of effects Total N Summary effect size Lower bound Upper bound Fail-safe N p .428 .001 8 1984 .193 .617 40 Networking .330 .008 9 1981 .090 .533 26 Education Convention environment .434 .000 11 2650 .248 .589 29 Destination image .297 .003 7 1818 .102 .469 16
PERCEPTION-SATISFACTION Number of effects Total N Summary effect size Lower bound Upper bound Fail-safe N p .389 .000 6 1321 .212 .541 24 Service quality .231 .023 3 471 .033 .412 4 Value
PERCEPTION-LOYALTY Number of effects Total N Summary effect size Lower bound Upper bound Fail-safe N p .533 .000 5 1286 .337 .685 26 Service quality .369 .011 6 1436 .089 .594 22 Value
SATISFACTION-LOYALTY Number of effects Total N Summary effect size Lower bound Upper bound Fail-safe N p Satisfaction- Loyalty .552 .000 9 1996 .374 .691 49
IMPLICATIONS Satisfaction relationships: networking and education are the top drivers of convention attendee satisfaction. Loyalty relationships: convention environment , networking , and perceptions of service quality strongly influence in convention attendee loyalty. Similar to hospitality research, a strong relationship between satisfaction and loyalty in conventions was confirmed by the meta-analysis.


")