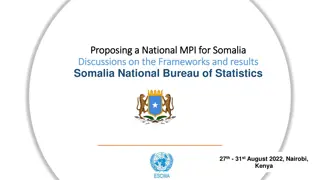
Co-financing Community-Driven Development Through Informal Taxation: Experimental Evidence from South-Central Somalia

Research explores the use of matching grants to incentivize informal taxation for community-driven projects in Somalia's Gedo region. Findings show increased informal contributions to public goods without crowding out other revenues, benefiting state legitimacy. Implications for development partners emphasized.

Download Presentation

Please find below an Image/Link to download the presentation.
The content on the website is provided AS IS for your information and personal use only. It may not be sold, licensed, or shared on other websites without obtaining consent from the author. Download presentation by click this link. If you encounter any issues during the download, it is possible that the publisher has removed the file from their server.
E N D
Presentation Transcript
Co-financing community-driven development through informal taxation: Experimental evidence from south-central Somalia Vanessa van den Boogaard and Fabrizio Santoro Research Fellows, International Centre for Tax and Development 11 May 2021 International Centre for Tax and Development International Centre for Tax and Development www.ictd.ac www.ictd.ac
Motivation Matching grants are commonly used to incentivize local revenue raising for local public goods projects Logic that increased participation increases ownership and accountability Limited evidence of impacts Risk of elite capture International Centre for Tax and Development www.ictd.ac
Outline and preview of key findings 1. Research design and data 2. Context of informal revenue generation in Gedo region Informal tax is prevalent, regressive, and complementary to local state institutions 3. Impacts of DIALOGUE matching grant programme: Increased informal contributions to public goods Improved public goods Did not crowd out other forms of local revenue raising Has positive spillover effects on the legitimacy of state and non-state actors 4. Implications for development partners a. a. b. c. d. International Centre for Tax and Development www.ictd.ac
(1) Research design and data International Centre for Tax and Development International Centre for Tax and Development www.ictd.ac www.ictd.ac
Research design RCT of NGO-led community- level interventions Eligibility (62 communities) Intervention (31 communities) Matching grants Transparency requirements (www.sokaab.com) Limitations to external validity: Opting in and collective action Relative security of region International Centre for Tax and Development www.ictd.ac
Data Household surveys (N 1300) at baseline (March 2018) and endline (February 2019) Community leader surveys (N 100) at baseline and endline Directly observable community-level data captured by enumerators Data on informal contributions and public goods expenditures recorded through mobile banking platform in treatment communities 1. 2. 3. 4. International Centre for Tax and Development www.ictd.ac
(2) Context of informal revenue generation in Gedo region International Centre for Tax and Development International Centre for Tax and Development www.ictd.ac www.ictd.ac
(a) Informal revenue generation is prevalent 71 percent of households paid at least one informal tax or fee in the previous year Communities depend on informal taxes to maintain public goods Informal payments represent on average 9.5% of income International Centre for Tax and Development www.ictd.ac
(b) Informal revenue generation is regressive Incidence of contributions on income (%) by income deciles Informal contributions by village wealth decile International Centre for Tax and Development www.ictd.ac
(c) Informal revenue generation can complement local state institutions Table 1. Number of informal contributions above median and tax morale (1) District govt (2) District govt (3) Village leaders (4) Village leaders (5) Clan elders (6) Clan elders (7) Religious leaders (8) Religious leaders 0.15*** 0.12*** 0.07*** 0.09*** 0.09*** 0.11*** 0.12*** 0.11*** IRG (0.03) (0.03) (0.02) (0.03) (0.04) (0.04) (0.03) (0.03) Controls No Yes No Yes No Yes No Yes Mean of Y 0.52 0.52 0.76 0.76 0.73 0.73 0.71 0.71 R-sq. 0.014 0.104 0.007 0.018 0.009 0.043 0.015 0.053 N 1224 1224 1259 1259 1258 1258 1232 1232 International Centre for Tax and Development www.ictd.ac
(3) Impacts of DIALOGUE matching grant programme International Centre for Tax and Development International Centre for Tax and Development www.ictd.ac www.ictd.ac
(a) Effects on informal contributions to public goods Table 2: Impact on new community development project projects (1) (2) (3) (4) Log contributions to new projects (USD) Log contributions to new projects (USD) Any new project Any new project Dialogue 0.13** (0.06) 0.14** (0.06) 0.68** (0.28) 0.62** (0.28) Controls No Yes No Yes Village FE Control Y endline R-sq. Observations Yes 0.37 0.387 880 Yes 0.37 0.390 880 Yes 6.60 0.491 1019 Yes 6.60 0.501 1019 Consistent results from leaders survey - table International Centre for Tax and Development www.ictd.ac
(b) Effects on public goods outcomes Table 3: Impact on reciprocity (1) (2) (3) (4) Dissatisfaction with new community development projects (max=5) Dissatisfaction with new community development projects (max=5) Perceptions of getting something in return for informal contributions Perceptions of getting something in return for informal contributions Dialogue -0.43*** (0.12) -0.45*** (0.12) 0.20** (0.09) 0.19** (0.10) Baseline outcome Controls - - No No Yes Yes No Yes Village FE Control Y endline Control Y baseline R-sq Observations Yes 4.16 - 0.372 998 Yes 4.16 - 0.375 998 Yes 0.66 0.22 0.451 570 Yes 0.66 0.22 0.471 570 Consistent enumerators assessment table and figure International Centre for Tax and Development www.ictd.ac
(b) Effects on public goods outcomes Mechanisms (1) Answerability hypothesis Strong impacts on individuals attending meetings, playing a role in monitoring community projects, asking leaders about public revenues, and raising issues with other community members - table International Centre for Tax and Development www.ictd.ac
(b) Effects on public goods outcomes Mechanisms (2) Transparency hypothesis In T, more likely to report that a distinct committee had been set up to manage the project, that they had been consulted in person about the project, and that the project had been decided through a community meeting - table however, individuals in T report less frequent information sharing and meetings about the project - table o International Centre for Tax and Development www.ictd.ac
(c) Spillover effects on other revenue raising Table 4: Impact on other informal contributions (1) (2) (3) (4) (5) (6) (7) (8) Village leader -0.01 (0.05) Village leader -0.00 (0.05) Religious Religious Clan Clan Pub. goods Pub. goods Dialogue 0.17*** (0.05) 0.17*** (0.05) 0.44*** (0.14) 0.44*** (0.14) 0.18* (0.11) 0.16* (0.11) Baseline outcome No Yes No Yes No Yes No Yes Controls No Yes No Yes No Yes No Yes Village FE Control Y endline R-sq. Observations Yes Yes Yes Yes Yes Yes Yes Yes 0.17 0.17 0.21 0.21 0.97 0.97 0.55 0.55 0.259 880 0.263 880 0.389 880 0.398 880 0.353 880 0.364 880 0.396 880 0.403 880 International Centre for Tax and Development www.ictd.ac
(d) Effects on perceptions of governance actors Table 5:Impact on actor s legitimacy (1) (2) (3) (4) (5) Clan 0.19*** (0.06) (6) Clan 0.19*** (0.06) (7) (8) District 0.22*** (0.07) District 0.22*** (0.07) Village 0.03 (0.05) Village 0.03 (0.06) Religious 0.25*** (0.06) Religious 0.25*** (0.06) Dialogue No Yes No Yes No Yes No Yes Baseline outcome Controls No Yes No Yes No Yes No Yes Village FE Control Y endline Control Y baseline R-sq. Observations Yes 0.67 Yes 0.67 Yes 0.77 Yes 0.77 Yes 0.68 Yes 0.68 Yes 0.66 Yes 0.66 0.45 0.45 0.65 0.65 0.66 0.66 0.61 0.61 0.324 866 0.330 866 0.259 869 0.267 869 0.314 867 0.318 867 0.360 847 0.366 847 International Centre for Tax and Development www.ictd.ac
(d) Effects on perceptions of governance actors - Mechanisms 1. Engagement and inclusivity Religious leaders and clan elders considerably improve not the village council 2. Performance-based mechanism Strong impact on transparency of, trust into, performance of district govt and religious leaders, negative for village council 3. Wrong attribution No evidence of misattribution - figure o 4. IRG as a mediator No evidence - table o International Centre for Tax and Development www.ictd.ac
(4) Implications and key takeaways International Centre for Tax and Development International Centre for Tax and Development www.ictd.ac www.ictd.ac
Key findings Matching grant programme: Improved the quality of public goods financed through informal taxes and perceptions of the fiscal reciprocity of informal taxes Local state actors benefit, while the impact on non-state actors is more complex International Centre for Tax and Development www.ictd.ac
Implications for development partners Development partners may effectively work with informal institutions of revenue raising, without necessarily undermining local state institutions Nevertheless, potential risks of incentivizing informal taxation, including: Reinforcing unaccountable informal institutions (risks for minorities) Reinforcing negative distributional impacts figure ; baseline Institutionalizing non-universal access to public goods, with implications for social cohesion/ conflict - table International Centre for Tax and Development www.ictd.ac
Thank you! Vanessa van den Boogaard and Fabrizio Santoro v.vandenboogaard@utoronto.ca, F.Santoro@ids.ac.uk @Vvandenboogaard International Centre for Tax and Development International Centre for Tax and Development www.ictd.ac www.ictd.ac
Appendices International Centre for Tax and Development International Centre for Tax and Development www.ictd.ac www.ictd.ac
A1: Impacts on contribution Leaders survey (1) (2) (3) (4) (5) (6) (7) (8) Log Tot. Contributi ons (USD) 1.07* Log Tot. Contributi ons (USD) 1.45** HHs % Contributi ng HHs % Contributi ng Log Avg Contributi on (USD) Log Avg Contributi on (USD) Any new project Any new project Dialogue 0.12* 0.17** 12.19** 18.03*** 0.14 0.16 (0.06) (0.07) (5.00) (5.60) (0.61) (0.64) (0.32) (0.34) Controls No Yes No Yes No Yes No Yes Control Y endline R-sq. 0.84 0.84 25.17 25.17 5.76 5.76 3.23 3.23 0.038 0.204 0.061 0.283 0.033 0.272 0.002 0.157 Observations 98 98 93 93 92 92 91 91 back International Centre for Tax and Development www.ictd.ac
A3.1: Observational data on the quality of projects I (1) (2) (3) (4) (5) (6) (7) (8) Completed (L) -0.05 Completed (L) -0.01 Access (E) 0.19* Completed (E) 0.00 Completed (E) 0.18 High quality (E) 0.30** High quality (E) 0.47*** Access (E) Dialogue 0.14 (0.09) (0.11) (0.10) (0.11) (0.11) (0.14) (0.14) (0.14) Controls No Yes No Yes No Yes No Yes Control Y endline 0.76 0.76 0.44 0.44 0.82 0.82 0.27 0.27 R-sq. 0.003 0.171 0.021 0.314 0.000 0.323 0.089 0.368 Observations 98 98 98 98 50 50 50 50 back International Centre for Tax and Development www.ictd.ac
A3.2: Observational data on the quality of projects II back International Centre for Tax and Development www.ictd.ac
A4: Accountability (1) (2) (3) (4) (5) (6) (7) (8) Monitor community project 0.11** (0.05) Monitor community project 0.11** (0.05) Raise issue wt other villagers 0.16*** (0.05) Raise issue wt other villagers 0.16*** (0.05) Attend meeting Attend meeting Ask abt revenues Ask abt revenues Dialogue 0.13*** (0.05) 0.14*** (0.05) 0.18*** (0.05) 0.18*** (0.05) Baseline outcome No Yes No Yes No Yes No Yes Controls No Yes No Yes No Yes No Yes Village FE Control Y endline Control Y baseline R-sq. Yes Yes Yes Yes Yes Yes Yes Yes 0.84 0.84 0.83 0.83 0.80 0.80 0.83 0.83 0.26 0.26 0.09 0.09 0.16 0.16 0.16 0.16 0.406 0.415 0.432 0.441 0.417 0.426 0.426 0.443 Obs. 880 880 880 880 880 880 880 880 back International Centre for Tax and Development www.ictd.ac
A5.1: Transparency (1) (2) (3) (4) (5) (6) Project committee formed 0.22*** (0.06) Project committee formed 0.20*** (0.06) Resp. Consulted Resp. Consulted Community decision Community decision Dialogue 0.18*** (0.05) 0.17*** (0.05) 0.09 (0.05) 0.10* (0.05) Controls No Yes No Yes No Yes Village FE Control Y endline R-sq. Obs. Yes Yes Yes Yes Yes Yes 0.33 0.33 0.38 0.38 0.35 0.35 0.413 957 0.423 957 0.344 1030 0.350 1030 0.421 1030 0.428 1030 back International Centre for Tax and Development www.ictd.ac
A5.2: Transparency (1) (2) (3) (4) Sharing Info Frequency (max=7) -0.45** Sharing Info Frequency (max=7) -0.45** Meeting Frequency (max=7) -0.73*** Meeting Frequency (max=7) -0.77*** Dialogue (0.22) (0.22) (0.23) (0.23) Controls No Yes No Yes Village FE Control Y endline R-sq. Yes Yes Yes Yes 4.30 4.30 4.25 4.25 0.392 0.397 0.373 0.382 Observations 1030 1030 1030 1030 back International Centre for Tax and Development www.ictd.ac
A6: Misattribution back International Centre for Tax and Development www.ictd.ac
A7: IRG as a mediator (1) (2) (3) (4) (5) Clan 0.16** (0.07) (6) Clan 0.16** (0.07) (7) (8) District 0.23*** (0.07) District 0.23*** (0.07) Village -0.00 (0.06) Village -0.00 (0.06) Religious 0.23*** (0.07) Religious 0.23*** (0.07) Dialogue Dialogue*IR G -0.05 -0.03 0.09 0.09 0.06 0.06 -0.03 -0.02 (0.08) 0.01 (0.05) (0.08) 0.01 (0.05) (0.08) -0.04 (0.06) (0.08) -0.05 (0.06) (0.08) 0.03 (0.06) (0.08) 0.03 (0.06) (0.07) 0.12** (0.06) (0.07) 0.12** (0.06) IRG Baseline outcome Controls Village FE Control Y endline Control Y baseline R-sq. No Yes No Yes No Yes No Yes No Yes Yes Yes No Yes Yes Yes No Yes Yes Yes No Yes Yes Yes 0.67 0.67 0.77 0.77 0.68 0.68 0.66 0.66 0.45 0.45 0.65 0.65 0.66 0.66 0.61 0.61 0.324 0.330 0.261 0.268 0.318 0.321 0.370 0.376 Obs. 866 866 869 869 867 867 847 847 back International Centre for Tax and Development www.ictd.ac
A8.1: Equity back International Centre for Tax and Development www.ictd.ac
A8.2: Equity from WP 118 Incidence of contributions on income (%) by income deciles Informal contributions by village wealth decile back International Centre for Tax and Development www.ictd.ac
A9: Social cohesion (1) (2) (3) (4) (5) (6) (7) (8) Public Lottery -0.04 Public Lottery -0.04 Trust in other clans -0.04 Trust in other clans -0.03 Resentment Resentment Unhappy Unhappy Dialogue 0.10* 0.11* -0.19*** -0.19*** (0.05) (0.05) (0.06) (0.06) (0.06) (0.06) (0.06) (0.06) Controls No Yes No Yes No Yes No Yes Village FE Control Y endline Control Y baseline R-sq. Yes Yes Yes Yes Yes Yes Yes Yes 0.83 0.83 0.43 0.43 0.79 0.79 0.30 0.30 - - - - 0.83 0.83 - - 0.358 0.361 0.394 0.397 0.258 0.271 0.382 0.389 Obs. 880 880 880 880 872 872 880 880 back International Centre for Tax and Development www.ictd.ac


 Research design and data")


 Context of informal revenue")
 Informal revenue generation is prevalent")
 Informal revenue generation is regressive")
 Informal revenue generation can")
 Impacts of DIALOGUE")
 Effects on informal contributions to public")
 Effects on public goods outcomes")
 Effects on public goods outcomes –")
 Effects on public goods outcomes –")
 Spillover effects on other revenue raising")
 Effects on perceptions of governance")
 Effects on perceptions of governance")
 Implications and key")