Regulation of Low Skilled Labour Migration from India
The regulation of low skilled labour migration from India involves legislative measures, such as the Emigration Act of 1983, which mandates emigration clearance for those migrating for employment to certain countries, mainly Gulf countries. The Act and Rules also outline the role of the Protector of Emigrants in granting clearances and overseeing recruiting agencies. Additionally, the government uses executive orders and bilateral agreements to manage various aspects of labour flows and welfare schemes related to migration.

Download Presentation

Please find below an Image/Link to download the presentation.
The content on the website is provided AS IS for your information and personal use only. It may not be sold, licensed, or shared on other websites without obtaining consent from the author. Download presentation by click this link. If you encounter any issues during the download, it is possible that the publisher has removed the file from their server.
E N D
Presentation Transcript
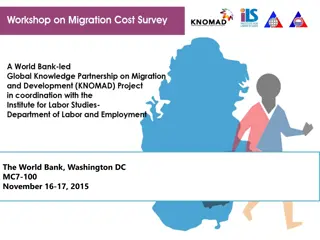
Migration Costs for Low Skilled Workers: India-Qatar Corridor Prabhu Mohapatra University of Delhi KNOMAD Workshop on Measuring Migration Costs for the Low-skilled The World Bank, Washington DC November 16-17, 2015
Regulation of Low Skilled Labour Migration from India Legislative Measures Emigration Act 1983 provides the regulatory framework for governing migration from India low skilled labour Emigration clearance is required for those migrating for employment to 18 countries (emigration check required countries mainly Gulf countries) Rules stipulates that emigration 2
Regulation of Low Skilled Labour Migration from India Rules states that emigration clearance is required only by persons whose educational attainment is below higher secondary (matriculate- 10th Grade ) Emigration clearances are granted by the Protector of Emigrants (in 10 POE offices in the country) after verifying employment contracts and other related documents The Act and Rules have elaborate provisions for governing the operation of the recruiting agencies ranging from issuing of registration certificate to offences and penalties 3
Regulation of Low Skilled Labour Migration from India Executive Orders Government of India has been increasingly resorting to executive orders ( reference to the Act and otherwise) to manage various dimensions of labour flows, like setting limits to agency fees, setting minimum wages, operationalising welfare schemes etc. Bilateral agreements with major labour receiving countries to manage migration 4
Regulation of Low Skilled Labour Migration from India 5
Regulation of Low Skilled Labour Migration from India 6
Regulation of Low Skilled Labour Migration from India 7
India-GCC Migration India-GCC, a major corridor of contemporary international migration flows Stock of Indian migrants in GCC countries have increased from 2.4 million in 1990 to 6.8 million in 2013 Indian migrants account for nearly 30 per cent of the estimated 22 million migrants in GCC Countries in 2013 Proportion of Indian migrants is relatively high in all GCC Countries 8
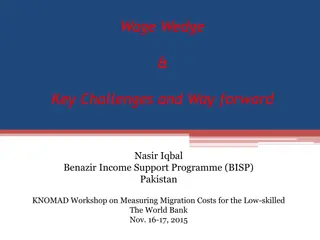
South Asian Migrants in GCC: 1990-2013 (Percentage of Migrants to the Total Migrants) Source: United Nations Department of Economic and Social Affairs. 9
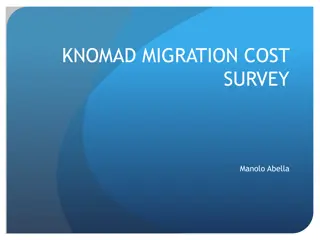
Indian Labour Migration Flows to GCC Countries: 2001-2014 (in 000) Note: Figures relate to the number of emigration clearance granted. Source: Ministry of Overseas Indian Affairs, Annual Reports. 10
India-Qatar Migration Flows Significant population in Qatar during 1990-2013 - from 129,147 in 1990 to 576,776 in 2013 increase in the Indian migrant Indians accounted for 36.1 per cent of the total migrant populations in Qatar in 2013 An overwhelming majority (82 per cent) were males 11
Indian Labour Migration to Qatar: 2001-2014 (in 000) Note: Figures relate to the number of emigration clearance granted. Source: Ministry of Overseas Indian Affairs, Annual Reports. 12
% Distribution of State-wise (Major States) Emigration Clearances to Qatar Source: Ministry of Overseas Indian Affairs. 13
Sample Design The first stage of the survey involved broad profiling of migrant workers returning from Qatar to India Profiling included both current migrants (those travelling to India on vacation and expected to return to Qatar within a short time) and return migrants (those returning after completing their contractual obligations) 14
Sample Design Profiling at three major airports, Mumbai, Delhi and Hyderabad To cover migrants originating from high out-migration of Andhra Pradesh, Bihar, Haryana, Maharashtra, Madhya Pradesh, Odisha, Punjab, Rajasthan and Uttar Pradesh Selected states were Hindi speaking states that way two major out migration States, Kerala and Tamil Nadu were not included in the survey Basic profiling covered nearly 1200 migrants 15
Sample Design Sample pre-fixed at 350 migrants Sample of 401 was drawn to take care of any possible sample loss by considering following inclusion criteria: Those returning from Qatar Last migration episode must be after 2011 Only low skilled male construction workers 16
Sample Characteristics Distribution of Sample by State State No. % Andhra Pradesh 37 9.23 Bihar 74 18.45 Gujarat 12 2.99 Haryana 24 5.99 Maharashtra 67 16.71 Madhya Pradesh 14 3.49 Punjab 18 4.49 Rajasthan 35 8.73 Uttar Pradesh 109 27.18 Others 11 2.74 Total 401 100.00 17
Sample Characteristics Age Composition of Migrants (in %) 19
Sample Characteristics Distribution of Respondents by Year of Most Recent Migration Year Number % 2011 98 24.50 2012 151 37.75 2013 119 29.75 2014 32 8.00 All Years 400 100.00 20
Sample Characteristics Percentage Distribution by Marital Status 21
Sample Characteristics Distribution of Sample by Level of Education Level of Education No. % Primary 3 0.75 Primary but below high school 348 86.79 Post Sec (incl. vocational training) 50 12.47 Total 401 100.00 22
Sample Characteristics Distribution of Sample by Family Support People Support No. % Up to 3 6 1.50 4-5 214 53.37 6-7 158 39.40 8 & more 23 5.74 Total Average number of family members supported 401 100.00 5.5 23
Sample Characteristics Percentage Distribution of Sample by State and Family Support People Support State Total Up to 3 0.00 0.00 0.00 0.00 0.00 0.00 0.00 0.00 5.50 0.00 1.50 4 5 48.65 47.30 41.67 58.33 56.72 57.14 77.78 62.86 51.38 36.36 53.37 6 - 7 51.35 40.54 58.33 41.67 40.30 42.86 22.22 37.14 33.94 45.45 39.40 8 & more 0.00 12.16 0.00 0.00 2.99 0.00 0.00 0.00 9.17 18.18 5.74 100.00 100.00 100.00 100.00 100.00 100.00 100.00 100.00 100.00 100.00 100.00 Andhra Pradesh Bihar Gujarat Haryana Maharashtra Madhya Pradesh Punjab Rajasthan Uttar Pradesh Others Total 24
Sample Characteristics Percentage of Migrants by Age Groups Supporting More than 5 Family Members 25
Sample Characteristics Distribution of Sample by Frequency of Migration First Outside No. % First time 311 77.56 More than once 90 22.44 Total 401 100.00 26
Sample Characteristics Percentage Distribution of Sample by Age Groups and Frequency of Migration First Outside Age Group Total First Time More than Once 20-24 25-29 30-34 35-39 40-44 45-49 Total 100.00 92.75 78.32 70.59 20.00 18.18 77.56 0.00 7.25 21.68 29.41 80.00 81.82 22.44 100.00 100.00 100.00 100.00 100.00 100.00 100.00 27
Sample Characteristics Distribution of Sample by Source of Information and Means of Recruitment Source of Information Means of Recruitment No. % No. % Agent/broker/recruiter 149 37.16 387 96.51 Relatives/friends 252 62.84 14 3.49 Total 401 100.00 401 100.00 28
Sample Characteristics Distribution of Respondents by Skill Tests Taken Skill Test No. % Yes 295 73.57 No 106 26.43 Total 401 100 29
Major Lessons/Challenges Airports may be the ideal site for conducting CAPI based surveys Most migrants tend to report costs in a consolidated manner Interviewers need to be very well trained to explain the components of costs and obtain the relevant information Difficulties encountered in direct on line transfer of questionnaires to CAPI server due to lack of internet penetration, particularly in rural areas Similar surveys in major migration corridors can provide significant inputs to formulate policies and programmes for reducing costs of low skilled migration 30
On Survey Questionnaire - Returnee Comprehensive to capture different dimensions of migration costs Some Confusing Options/Questions and Unanswered Questions option between recruitment agent/broker and manpower agency (q.no. job_application_how) 2.1 variable: visa costs (q.no. 2.40 variable: cost_visa) Visa is obtained by the employer and forwarded to worker through agent or directly. Agents may charge an amount in the name of visa , so should that not be regarded as agent s fees?) 31
On Survey Questionnaire - Returnee use of skills (q.no. 4.18 variable : believe_useskill; and 4.19 variable: amount_useskills) involves subjectivity and assumes availability of all labour market information with respondents) taxes, social security, foreign worker levy (q.no. 5.20 variable: amount_deducted ) respondents not able to give satisfactory responses amount amount_sent) responses refers to their savings and not remittances per se, some part of these may be remitted , some portion transferred through friends or some part carried along while they return home) sent home (q.no. 5.24 variable: 32
CAPI Method : Our Feedback Very User Friendly Pre Survey Training to interviewers important Presence of CAPI team member(s) during such training at the survey centre is very critical Direct on line transfer of questionnaires to CAPI server had problems due to lack of internet penetration, particularly in rural areas 33
THANK YOU 34


")