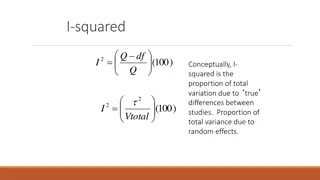
Understanding Confidence Intervals, Cross-Validation, and Predictor Selection in Statistics
This content covers topics such as confidence intervals for individual points versus regression lines, various predictor selection techniques like forward, backward, stepwise regression, and the importance of cross-validation in predictive modeling. It also delves into the significance of prediction and explanation in different scenarios, showcasing the relevance of statistical concepts in real-world applications.

Download Presentation

Please find below an Image/Link to download the presentation.
The content on the website is provided AS IS for your information and personal use only. It may not be sold, licensed, or shared on other websites without obtaining consent from the author. Download presentation by click this link. If you encounter any issues during the download, it is possible that the publisher has removed the file from their server.
E N D
Presentation Transcript
Prediction Confidence Intervals, Cross- validation, and Predictor Selection
Skill Set Why is the confidence interval for an individual point larger than for the regression line? Describe the steps in forward (backward, stepwise, blockwise, all possible regressions) predictor selection. What is cross- validation? Why is it important? What are the main problems as far as R- square and prediction are concerned with forward (backward, stepwise, blockwise, all possible regressions)
Prediction v. Explanation Prediction is important for practice WWII pilot training Ability tests, e.g., eye-hand coordination Built an airplane that flew Fear of heights Favorite flavor ice cream Age and driving accidents Explanation is crucial for theory. Highly correlated vbls may not help predict, but may help explain. Team outcomes as function of team resources and team backup.
Confidence Intervals Data from Partial Correlation Example CI for the line, i.e., the mean score: 5 Confidence Interval for Indivdual Predicted Values Note shape. 4 2 ( ) 1 N X X = + 2 y i S S ' . x 2 x GPA 3 = ' CI Y t S 2 ( , 2 / ) ' df Confidence Interval for Regression Line (Mean) 2 y S 1 =MSR. N= sample size. The df are for MSR (variance of residuals). 400 500 600 700 .x GRE CI for a single person s score: 2 ( ) 1 N X X = + + 2 y 1 i S S ' . Y x 2 x = ' CI Y t dfS ( , 2 / ) ' Y
Computing Confidence Intervals Suppose: = ; 20 S N X Y 75 . 05 . 5 ' + = Find CI for line (mean) at X=1. = = = 2 y 2 . 5 983 ; ; 3 40 X x . x 40 2 1 1 ( ) 3 2 ( ) 1 N X X = + = + 2 y 947 . . 5 983 i S S ' . x 2 x 20 = + = + = df = N-k-1 = 20-1-1 = 18. ' . 5 05 75 . . 5 05 75 . ) 1 ( . 5 80 Y X = For an individual at X=1, what is the CI? 8 . 5 = . 2 ( ' 101 )(. 947 ) CI Y t S CI = 3.81 to 7.79 ( , 2 / ) ' df 40 2 2 1 1 ( ) 3 ( ) 1 N X X = + + = + + 2 y . 2 623 . 5 983 1 1 i S S ' . Y x 2 20 x = 8 . 5 = . 2 ( ' 101 )( . 2 623 ) CI Y t dfS CI = .29 to 11.31 ( , 2 / ) ' Y
Review Why is the confidence interval for the individual wider than a similar interval for the regression line? Why are the confidence intervals regression curved instead of being straight lines?
Shrinkage R2 is biased (sample value is too large) because of capitalizing on chance to minimize SSe in sample. If the population value of R2 is zero, the expected value in the sample is R2 =k/(N-1) where k is the number of predictors and N is the number of people in the sample. If you have many predictors, you can make R2 as large as you want. What is the expected value of R-square if N = 101 and k =10? Ethical issue here. Common adjustment or shrinkage formula: 1 N Use summary(lm.object) to see R-square and adjusted R-square. = 2 2 1 ( 1 ) R R 1 N k
Shrinkage Examples Suppose R2 is .6405 with k = 4 predictors and a sample size of 30. Then ( . R2 1 1 6405 = 30 1 30 4 1 = ) . 583 R2 = .6405 N= 15 30 100 R2 = .30 N= 15 30 100 Adj R2 Adj R2 .497 .583 .625 .020 .188 .271 Note small N means lots of shrinkage but also smaller initial R2 shrinks more.
Cross-Validation Compute a and b(s) (can have one or more IVs) on initial sample. Find new sample, do not estimate a and b, but use a and bto find Y . Compute correlation between Y and Y in new sample; square. Ta da! Cross- validation R2. Cross-validation R2 does not capitalize on chance and estimates operational R2.
Cross-validation (2) Double cross-validation Data splitting Expert judgment weights (don t try this at home) Math Estimates + + 30 1 30 4 1 + + 1 1 N N k = 513 . 1 1 ( 6405 . ) = 2 2 1 1 ( ) RCV R Fixed: 30 30 4 1 1 N N k + 1 2 1 N N N = 2 2 1 1 ( ) RCV R Random: 1 2 N k N k N
Review What is shrinkage in the context of multiple regression? What are the things that affect the expected amount of shrinkage? What is cross-validation? Why is it important?
Predictor Selection Widely misunderstood and widely misused. Algorithms labeled forward, backward, stepwise, etc. NEVER use for work involving theory or explanation (hint: this clearly means your thesis and dissertation). NEVER use for estimating importance of variables. Use SOLELY for economy (toss predictors).
All Possible Regressions Data from Pedhazur example. GPA (Y) 1 GREQ GREV MAT AR GPA (Y) GREQ GREV MAT AR Mean S.D. .611 .581 .604 .621 3.313 .600 1 .468 .267 .508 565.333 48.618 1 .426 .405 575.333 83.03 1 .525 67.00 9.248 1 3.567 .838 GPA is grade point average. GREQ is Graduate Record Exam, Quantitative. GREV is GRE Verbal. MAT is Miller Analogies Test. AR is Arithmetic Reasoning test.
All Possible Regressions (2) R2 Variables in Model k Note how easy it is to choose the model with the highest R2 for any given number of predictors. In predictor selection, you also need to worry about cost. You get both V and Q GRE in one test. Also consider what change in R2 means. Accuracy in prediction of dropout. 1 1 1 1 .385 .384 .365 .338 AR GREQ MAT GREV 2 2 2 2 2 2 .583 .515 .503 .493 .492 .485 GREQ MAT GREV AR GREQ AR GREV MAT MAT AR GREQ GREV 3 3 3 3 .617 .610 .572 .572 GREQ GREV MAT GREQ MAT AR GREV MAT AR GREQ GREV AR 4 .640 GREQ GREV MAT AR
Predictor Selection Algorithms Forward build up from start with p value. End when no variables meet PIN. May include duds. Backward Start with all vbls and pull out with POUT. May lose gems. Stepwise Start forward, check backward at each step. Not guaranteed to give best R2. Blockwise not used much. Forward by blocks, then any method (eg stepwise) within block to choose best predictors.
Things to Consider in PS Algorithms consider statistical significance, but you have to consider practical significance and cost, i.e., algorithms don t work well. Surviving variables are often there by chance. Do the analysis again and you would choose a different set. OK for prediction. The value of correlated variables is quite different when considered in path analysis and SEM.
Hierarchical Regression Alternative to predictor selection algorithms Theory based (a priori) tests of increments to R-square
Example of Hierarchical Reg Does personality increase prediction of med school success beyond that afforded by cognitive ability? Collect data on 250 med students for first two years. Model 1: R2=.10 , p<.05 = + + MedGPA a b UgGPA 1 b MAT 2 Model 2 R2=.13 , p<.05 = + + + + MedGPA a b UgGPA 1 b MAT b Consc 3 b NA 2 4 Model test: /( ) 2 L N R ) 2 2 L 2 S ( ) (. 13 10 . ) /( 4 R R df df = = L S F ) 1 ) 1 1 ( ) /( 1 ( 13 . ) /( 250 4 k L F(2,245)=4.22, p < .05
Review Describe the steps in forward (backward, stepwise, blockwise, all possible regressions) predictor selection. What are the main problems as far as R- square and prediction are concerned with forward (backward, stepwise, blockwise, all possible regressions) Why avoid predictor selection algorithms when doing substantive research (when you want to explain variance in the DV)?


")


")