Mechanical Behavior of Structures: Stress-Strain Diagrams and Elastic Properties
Understanding the mechanical behavior of structures involves analyzing stress-strain diagrams, distinguishing between ductile and brittle materials, exploring linear and non-linear elastic properties, studying plastic deformation, yield strength, ultimate tensile strength, and toughness. Elastic behavior, Hooke's Law, linear elastic properties, and the concepts of elastic limit and compliance are key aspects discussed in this study.

Uploaded on Sep 29, 2024 | 0 Views
Download Presentation

Please find below an Image/Link to download the presentation.
The content on the website is provided AS IS for your information and personal use only. It may not be sold, licensed, or shared on other websites without obtaining consent from the author. Download presentation by click this link. If you encounter any issues during the download, it is possible that the publisher has removed the file from their server.
E N D
Presentation Transcript
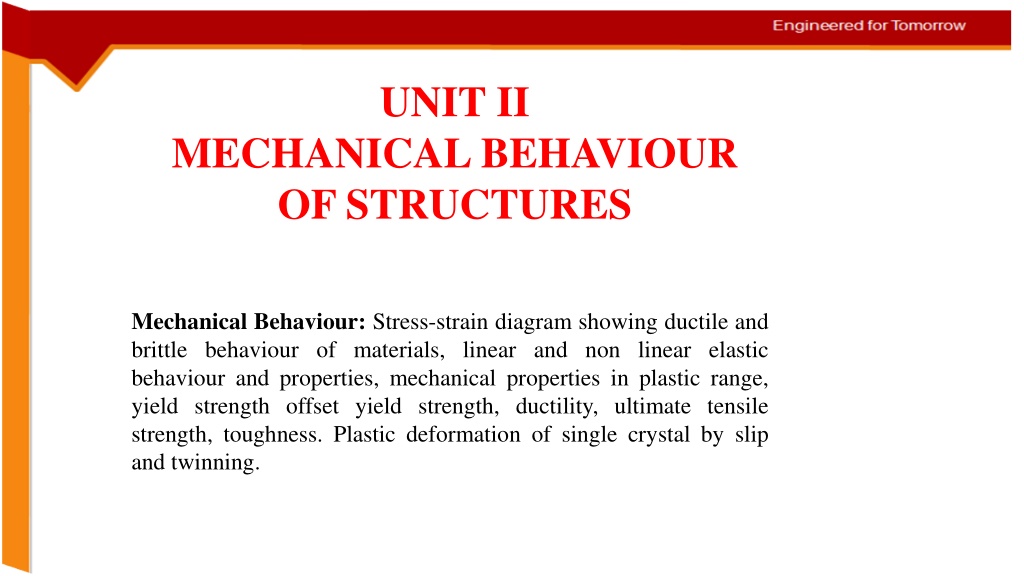
UNIT II MECHANICAL BEHAVIOUR OF STRUCTURES Mechanical Behaviour: Stress-strain diagram showing ductile and brittle behaviour of materials, linear and non linear elastic behaviour and properties, mechanical properties in plastic range, yield strength offset yield strength, ductility, ultimate tensile strength, toughness. Plastic deformation of single crystal by slip and twinning.
Due to collective motion of many dislocations Yield point UTS s e Elastic region Usually expressed as (for plastic) Elastic + Plastic region n = K Fracture X plastic plastic UTS- Ultimate Tensile Strength
Elastic behaviour When a solid material is subjected to external load, up to certain limiting loads the same solid will recover its original dimensions when the load is removed. The recovery of the original dimensions of a deformed body when the load is removed is known as elastic behaviour . (stress and strain are proportional) The limiting load beyond which material no longer behaves elastically is the elastic limit
Hookes law Hooke s law For most materials, as long as the load doesn t exceed the elastic limit, the deformation is proportional to the load. This relationship is known as Hooke s law; it is more frequently stated as stress is proportional to strain Elastic deformations in metals are quite small and require very sensitive instruments for their measurement The inverse of Young s modulus is known as the compliance of the material (or) The inverse of stiffness is compliance, typically measured in units of metres per newton
Linear elastic properties When stress is proportional to strain, elastic region shows the mechanical properties called: 1. stiffness 2. elastic strength 3. resilience A material with high value of modulus of elasticity is said to be stiff and a material with low value of modulus of elasticity is said to be resilient
Stiffness: of a material is defined as its ability to resist the elastic deformation Materials having high stiffness show less elastic deformation under load Modulus of elasticity is the measure of stiffness of a material Elastic strength: is a highest stress at which the behaviour of the material remains elastic Resilience: is the capacity of a material to absorb energy when it is deformed elastically and then, upon unloading, to have this energy recovered As a material is deformed by an external loading, it tends to store energy internally throughout its volume. Since this energy is related to the strains in the material, it is referred to as strain energy.
The associated property is the modulus of resilience, Ur, which is the strain energy per unit volume required to stress a material from an unloaded state up to the point of yielding Ur = ? ? ? ??/E ??? ?? ??
It indicates the strain-energy density of the material just before it fractures. This property becomes important when designing members that may be accidentally overloaded. Alloying metals can also change their resilience and toughness. For example, by changing the percentage of carbon in steel, the resulting stress strain diagrams in Fig (next slide) show how the degrees of resilience and toughness can be changed
Schematic representations of tensile stress strain behaviour for brittle and ductile metals loaded to fracture.
Non Non- -linear elastic properties linear elastic properties When stress is not directly proportional to strain, the curve is non- linear The properties identified in this region are: Secant modulus and Tangent modulus Tangent modulus is taken as the slope of the stress strain curve at some specified level of stress, whereas secant modulus represents the slope of a secant drawn from the origin to some given point of the curve
Plastic behaviour Plastic behaviour Stress Stress- -strain curve for M.S strain curve for M.S If the elastic limit is exceeded, the body will experience a permanent set or deformation when the load is removed. A body permanently deformed is said to have undergone plasticdeformation which is
Plastic flow in single crystals Plastic flow in single crystals F Consider a single crystal subjected to a uniaxial tension as shown in Figure. At room temperature the major source for plastic deformation is the dislocation motion through the crystal lattice. Outward normal Slip direction Dislocation motion occurs on fixed crystal planes ( slip planes ) in fixed crystallographic directions (corresponding to the Burgers vector of the dislocation that carries the slip). As Slip plane A o The crystal structure of metals is not altered by the plastic flow.
Plastic flow in single crystals Plastic flow in single crystals Note: The plane normal, external applied force and the slip directions need not be coplanar ( + 900). It means, slip may not occur in the direction of the max. shear stress. F Outward normal The resolved shear stress is now the ratio of the resolved shear force to the area of the slip plane. Force Force acting acting on on the the slip slip plane plane = = Fcos Fcos Slip direction cos Area Area of of the the slip slip plane plane A As s= =A Ao o/ /cos As Slip plane cos cos cos F F F = = = s Ao RSS A A A s s o = 1 = RSS m m where, cos cos 1/m = Schmid Boas factor
Plastic flow in single crystals Plastic flow in single crystals F Plastic flow initiates when the resolved shear stress reaches a critical value: = m Outward normal Y CRSS where, CRSS is the critical resolved shear stress, and Y is the yield stress of the material. Slip direction The value of CRSS depends on temperature, strain rate, initial dislocation density and purity. As Slip plane Ao The maximum Ris when = = 45o. Or CRSS= 0 when = 0 or = 0.
Macroscopic slip in a single crystal Macroscopic slip in a single crystal
Deformation by twinning Deformation by twinning Twinning occurs as atoms on one side of the boundary (plane) are located in mirror image positions of the atoms on the other side. The boundary is called twinning boundary. Twin results from atomic displacements produced from; 1) Applied mechanical shear force 2) During annealing heat treatment (annealing twin) : in FCC. Note: twinning normally occurs when slip systems are restricted or when the twinning stress > critical resolved shear stress. (mechanical twin) : in BCC, HCP
Deformation by slip Deformation by twinning
Characteristics of twinning Characteristics of twinning Appears as broad lines or bands Planes of atoms move fractional distances Requires higher shear stress Occurs in metals having less number of slip systems
Engineering Stress (s) and Strain (e) The engineering stress, or conventional stress, is the load divided by the original area. ? =? ?? Engineering strain is defined as the ratio of change in length of the test specimen to its original length and is given by ? = ? ??
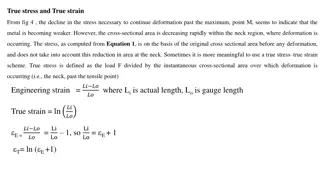
True stress( True stress(?) and true strain ) and true strain( ) ) True stress is the load at any instant divided by the cross-sectional area over which it acts ? =? ? True strain is defined as the instantaneous elongation per unit length of the test specimen ?=???? ? (because of constancy of volume AoLo=AL)
Comparison between Engineering and True quantities Stress Strain ? ??(engineering stress) ? =? ?(true stress) ? =? ?? ? ?= ? = ?? ? = ? e+1=? ?? = ? ?? ? ?? ? ? = = ?? ?? ? ?? = ?? ? = ? ? ??= ? + ? ? ?? = ?? ? + ? ?? =ln(e+1) ? + ? = ?(e+1)
A comparison of typical tensile engineering stress A comparison of typical tensile engineering stress strain and true stress behaviours behaviours strain and true stress strain strain
Proof stress The equivalent of yield stress in materials which have no clearly defined yield point Commonly the stress to produce 0.2% extension is quoted in N/mm2 for steel. This value approximates to the yield stress in materials not exhibiting a definite yield point Each inch of chart on the X-axis represents 0.2% (0.002 in./in.) of specimen elongation or extension


 and Strain (e)")