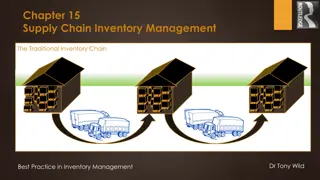
Intensive Course on Stock Control and Inventory Management
This intensive course, led by Prof. Takao Ito, focuses on stock control and inventory management, exploring topics such as economic order quantity, two systems in stock control, and the supervision of supply and accessibility of items to maintain optimal stock levels. Participants will delve into decision-making related to stockkeeping based on business size and nature, and the efficient utilization of available space for stock storage.

Download Presentation

Please find below an Image/Link to download the presentation.
The content on the website is provided AS IS for your information and personal use only. It may not be sold, licensed, or shared on other websites without obtaining consent from the author. Download presentation by click this link. If you encounter any issues during the download, it is possible that the publisher has removed the file from their server.
E N D
Presentation Transcript
Guiding Principles The Pursuit of Peace The Creation of New Forms of Knowledge The Nurturing of Well-Rounded Human Beings Collaboration with the Local, Regional, and International Community Continuous Self-Development Intensive Course of The MOT and Venture Business Prof. Takao Ito, Doctor of Economics, PH.D. of Engineering, Graduate School of Advanced Science and Engineering, Hiroshima University E-Mail: itotakao@Hiroshima-u.ac.jp 1
Schedule MOT and Venture Business (An Intensive Course) 08:50-16:20, Saturday and Sunday No. Date 1 2023/10/21Sat Outlines and Introduction 2 2023/10/21Sat The evolution of Management 3 2023/10/21Sat Key Issues in Corporate Management 4 2023/10/21Sat Break-Even Point Analysis 5 2023/10/22Sun Cost Benefit Analysis and Ethics 6 2023/10/22Sun Stock Control 7 2023/10/22Sun Case Studies and Group Discussion 8 2023/10/22Sun Kaizen and Quality Control 9 2023/11/11Sat Motivation (self Learning) 10 2023/11/11Sat Organization Structure 11 2023/11/11Sat Decision-making and Strategy 12 2023/11/11Sat Leadership 13 2023/11/12Sun Business Plan 14 2023/11/12Sun Entrepreneur and Venture Business 15 2023/11/12Sun Presentation and/or Final Examination 16 2023/11/12Sun Review and Free Discussion Lecture 08:50-10:20 10:30-12:00 13:10-14:40 14:50-16:20 08:50-10:20 10:30-12:00 13:10-14:40 14:50-16:20 08:50-10:20 10:30-12:00 13:10-14:40 14:50-16:20 08:50-10:20 10:30-12:00 13:10-14:40 14:50-16:20 2
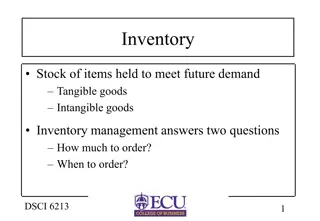
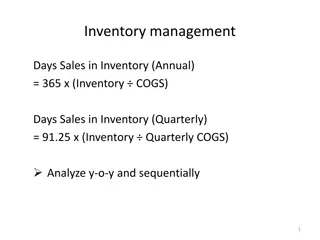
Agenda 1. Stock Control and Inventory 2. Tow Systems in Stock Control 3. Economic Order Quantity (EOQ) 4
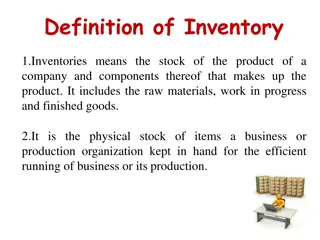
Stock Control and Inventory Inventory Control is the supervision of supply, storage and accessibility of items in order to ensure an adequate supply without excessive oversupply. Stock control is defined as "the activity of checking a shop s stock".
Deciding how much stock to keep depends on the size and nature of your business, and the type of stock involved. If you are short of space you may be able to buy stock in bulk and then pay a fee to your supplier to store it, calling it off as and when needed.
Keeping little or no stock and negotiating with suppliers to deliver stock as you need it. Advantages Disadvantages Efficient and flexible - you only have what you need, when you need it Meeting stock needs can become complicated and expensive Lower storage costs You might run out of stock if there's a hitch in the system You can keep up to date and develop new products without wasting stock You are dependent on the efficiency of your suppliers
Keeping little or no stock and negotiating with suppliers to deliver stock as you need it. opportunity cost The cost of an alternative that must be forgone in order to pursue a certain action. Put another way, the benefits you could have received by taking an alternative action.
Keeping lots of stock Advantages Disadvantages Can meet sudden changes in demand Costs of storage rent and insurance Less chance of loss of production time because of stock outs Money tied up in stocks not being used elsewhere in the business Can take advantage of bulk buying economies of scale Large stocks subject to deterioration and theft
2 2 Tow Systems in Stock Tow Systems in Stock Control Control Fixed order quantity system Periodic ordering system
Stock Control the demand=D occurs at a constant rate and that there is no variability in demand. the lead time=L is constant. the holding cost=H is known and fixed stockout cost=S unit price=C
2-1 Fixed order quantity system the system assumes that all the variables occur at a constant rate and their values are known with certainty. Although these assumptions are not realistic the model is highly robust and provides excellent results despite these assumptions.
Fixed order quantity system Fixed order quantity system Stock Certain Level Time 0
2 2- -2 Fixed Periodic ordering system 2 Fixed Periodic ordering system It is an inventory control method where orders are periodically placed, but the order quantity is different every time, and is also called Fixed Period Deficit Ordering System.
Fixed Periodic ordering system Fixed Periodic ordering system An order is periodically placed. The order quantity is different every time. Even relatively large fluctuations in demand can be handled properly. Even seasonal variation can be handled modestly. The inventory volume can be reduced compared with ordering point system. * A-group items are usually best for this
Periodic ordering system Periodic ordering system Stock 0 March 1st April 1st May 1st June 1st July 1st
How many to order? Total demand in the lead time LD
Case 1: the demand occurs at a constant Case 1: the demand occurs at a constant rate its values is known with certainty rate its values is known with certainty Total demand per month D 600 pcs Lead time L 10 days Stock 0 June 1st June 10th
Case 2: orders are periodically placed, but the Case 2: orders are periodically placed, but the order quantity is different every time order quantity is different every time Demand per month= Lead time=L Initial stock = D L D
The central limit theorem states that under certain (fairly common) conditions, the demand will have an approximately normal distribution. 2 ( , ) N D D Lead time=L Order quantity = + P L D z L D
Z Z 0.0 0.0 .0000 0.1 0.1 .0398 0.2 0.2 .0793 0.3 0.3 .1179 0.4 0.4 .1554 0.5 0.5 .1915 0.6 0.6 .2257 0.7 0.7 .2580 0.8 0.8 .2881 0.9 0.9 .3159 1.0 1.0 .3413 1.1 1.1 .3643 1.2 1.2 .3849 1.3 1.3 .4032 1.4 1.4 .4192 1.5 1.5 .4332 1.6 1.6 .4452 1.7 1.7 .4554 1.8 1.8 .4641 1.9 1.9 .4713 2.0 2.0 .4772 2.1 2.1 .4821 2.2 2.2 .4861 2.3 2.3 .4893 2.4 2.4 .4918 2.5 2.5 .4938 2.6 2.6 .4953 2.7 2.7 .4965 2.8 2.8 .4974 2.9 2.9 .4981 3.0 3.0 .4987 3.1 3.1 .4990 3.2 3.2 .4993 0 0 0.01 0.01 .0040 .0438 .0832 .1217 .1591 .1950 .2291 .2611 .2910 .3186 .3438 .3665 .3869 .4049 .4207 .4345 .4463 .4564 .4649 .4719 .4778 .4826 .4864 .4896 .4920 .4940 .4955 .4966 .4975 .4982 .4987 .4991 .4993 0.02 0.02 .0080 .0478 .0871 .1255 .1628 .1985 .2324 .2642 .2939 .3212 .3461 .3686 .3888 .4066 .4222 .4357 .4474 .4573 .4656 .4726 .4783 .4830 .4868 .4898 .4922 .4941 .4956 .4967 .4976 .4982 .4987 .4991 .4994 0.03 0.03 .0120 .0517 .0910 .1293 .1664 .2019 .2357 .2673 .2967 .3238 .3485 .3708 .3907 .4082 .4236 .4370 .4484 .4582 .4664 .4732 .4788 .4834 .4871 .4901 .4925 .4943 .4957 .4968 .4977 .4983 .4988 .4991 .4994 0.04 0.04 .0160 .0557 .0948 .1331 .1700 .2054 .2389 .2704 .2995 .3264 .3508 .3729 .3925 .4099 .4251 .4382 .4495 .4591 .4671 .4738 .4793 .4838 .4875 .4904 .4927 .4945 .4959 .4969 .4977 .4984 .4988 .4992 .4994 0.05 0.05 .0199 .0596 .0987 .1368 .1736 .2088 .2422 .2734 .3023 .3289 .3531 .3749 .3944 .4115 .4265 .4394 .4505 .4599 .4678 .4744 .4798 .4842 .4878 .4906 .4929 .4946 .4960 .4970 .4978 .4984 .4989 .4992 .4994 0.06 0.06 .0239 .0636 .1026 .1406 .1772 .2123 .2454 .2764 .3051 .3315 .3554 .3770 .3962 .4131 .4279 .4406 .4515 .4608 .4686 .4750 .4803 .4846 .4881 .4909 .4931 .4948 .4961 .4971 .4979 .4985 .4989 .4992 .4994 0.07 0.07 .0279 .0675 .1064 .1443 .1808 .2157 .2486 .2794 .3078 .3340 .3577 .3790 .3980 .4147 .4292 .4418 .4525 .4616 .4693 .4756 .4808 .4850 .4884 .4911 .4932 .4949 .4962 .4972 .4979 .4985 .4989 .4992 .4995 0.08 0.08 .0319 .0714 .1103 .1480 .1844 .2190 .2517 .2823 .3106 .3365 .3599 .3810 .3997 .4162 .4306 .4429 .4535 .4625 .4699 .4761 .4812 .4854 .4887 .4913 .4934 .4951 .4963 .4973 .4980 .4986 .4990 .4993 .4995 0.09 0.09 .0359 .0753 .1141 .1517 .1879 .2224 .2549 .2852 .3133 .3389 .3621 .3830 .4015 .4177 .4319 .4441 .4545 .4633 .4706 .4767 .4817 .4857 .4890 .4916 .4936 .4952 .4964 .4974 .4981 .4986 .4990 .4993 .4995 ? ? ?? = 0.025 Z? ?? ? ? ?? = 0.475 0 ??= 1.96
.00 .01 .02 .03 .04 .05 .06 .07 .08 .09 0.0 1.0000 .9920 .9840 .9760 .9680 .9602 .9522 .9442 .9362 .9282 0.1 0.2 0.3 0.4 0.5 0.6 0.7 0.8 0.9 1.0 1.1 1.2 1.3 1.4 1.5 1.6 1.7 1.8 1.9 .9204 .8414 .7642 .6892 .6170 .5486 .4840 .4238 .3682 .3174 .2714 .2302 .1936 .1616 .1336 .1096 .0892 .0718 .0574 .9124 .8336 .7566 .6818 .6100 .5418 .4776 .4180 .3628 .3124 .2670 .2262 .1902 .1586 .1310 .1074 .0872 .0702 .0562 .9044 .8258 .7490 .6744 .6030 .5352 .4716 .4122 .3576 .3078 .2628 .2224 .1868 .1556 .1286 .1052 .0854 .0688 .0548 .8966 .8180 .7414 .6672 .5962 .5286 .4654 .4066 .3524 .3030 .2584 .2186 .1836 .1528 .1260 .1030 .0836 .0672 .0536 .8886 .8104 .7338 .6600 .5892 .5222 .4592 .4010 .3472 .2984 .2542 .2150 .1802 .1498 .1236 .1010 .0818 .0658 .0524 .8808 .8026 .7264 .6528 .5824 .5156 .4532 .3954 .3422 .2938 .2502 .2112 .1770 .1470 .1212 .0990 .0802 .0644 .0512 .8728 .7948 .7188 .6456 .5754 .5092 .4472 .3898 .3370 .2892 .2460 .2076 .1738 .1442 .1188 .0970 .0784 .0628 .0500 .8650 .7872 .7114 .6384 .5686 .5028 .4412 .3842 .3320 .2846 .2420 .2040 .1706 .1416 .1164 .0950 .0768 .0614 .0488 .8572 .7794 .7040 .6312 .5620 .4964 .4354 .3788 .3270 .2802 .2380 .2006 .1676 .1388 .1142 .0930 .0750 .0602 .0478 .8494 .7718 .6966 .6242 .5552 .4902 .4296 .3734 .3222 .2758 .2340 .1970 .1646 .1362 .1118 .0910 .0734 .0588 .0466 2.0 .04550 .04444 .04338 .04236 .04134 .04036 .03940 .03846 .03752 .03662 2.1 .03572 .03486 .03400 .03318 .03236 .03156 .03078 .03000 .02926 .02852 2.2 .02780 .02710 .02642 .02574 .02510 .02444 .02382 .02320 .02260 .02202 2.3 .02144 .02088 .02034 .01980 .01928 .01878 .01828 .01778 .01732 .01684
= D 600(pcs ; Average demand per month 2 = 900; days D = L 10 ); = Pr 5 % obability for stockout 10 = = 10 D 600 200(pcs ; Average demand per days 10 30 10 2 10 = = 10 900 300; Variance per days D 30 2 = = = tan 10 300 17 ; 3 . s dard deviation per days D10 10 D = . 1 = 96 z z . 0 05
Order quantity 1 1 = + = . 1 + = 600 96 30 234 ( ) P L D z L pcs D 3 3
3Economic Order Quantity (EOQ) The value of the average stockholding = (Q/2 x item cost/value) where Q is the order quantity. The holding cost/unit (Ch) is derived from the average inventory value) multiplied by the cost of carrying the item over the period (one year) expressed as a % of the item cost/value.
Optimizing Economic Order Quantity (EOQ) Q = cos Holding ts C h 2 Chis the holding cost per unit. It is also called carrying costs. Q is the order quantity
Order cost (Co) is derived from the number of orders placed (D/Q - demand p.a. divided by order quantity) multiplied by the cost of placing an order. D = cos Ordering ts C o Q Co ordering cost D demand per year Q order quantity
Total cost=Holding cost + Order cost QC 2 DC = h+ o TC Q 2 DC = o Q C h
Case 3 As an example, in a company where order cost is estimated at $10 and with a holding cost of 25% of item value if annual demand is 1000 units at a supply price of $36. Calculate the EOQ.
Answer 2 2 1000 10 DC = = = 47 1 . ( ) o EOQ pcs . 0 36 25 C h the EOQ is 48 units
ExerciseEOQ In a company where the total demand each year is 7,200 pcs, and ordering cost is estimated at 2,000 Japanese Yen. The EOQ is 400 pcs. Calculate the holding cost per unit each year.
ExerciseEOQ In a company where the total demand each year is 7,200 pcs, and ordering cost is estimated at 2,000 Japanese Yen. The EOQ is 400 pcs. Calculate the holding cost per unit each year. 2 2 2000 7200 DC = = 400 o C C h h = Less CHmore EOQ 180 Ch JapaneseYe n
Thank you for your attention! Thank you for your attention!


")

 is derived from the")