Challenges and Methodology of the Indian Census Program
The Indian Census is the world's largest administrative exercise, capturing the economic, social, and cultural snapshot of a multiethnic society. Managing vast and diverse provinces with millions of households and enumerators poses significant challenges. The methodology involves freezing administrative boundaries, preparing enumeration blocks, and conducting house listing and population enumeration phases. The census of India 2011 utilized a face-to-face canvasser method with paper questionnaires, showcasing the country's demographic and economic profile rich in data products.

Download Presentation

Please find below an Image/Link to download the presentation.
The content on the website is provided AS IS for your information and personal use only. It may not be sold, licensed, or shared on other websites without obtaining consent from the author. Download presentation by click this link. If you encounter any issues during the download, it is possible that the publisher has removed the file from their server.
E N D
Presentation Transcript
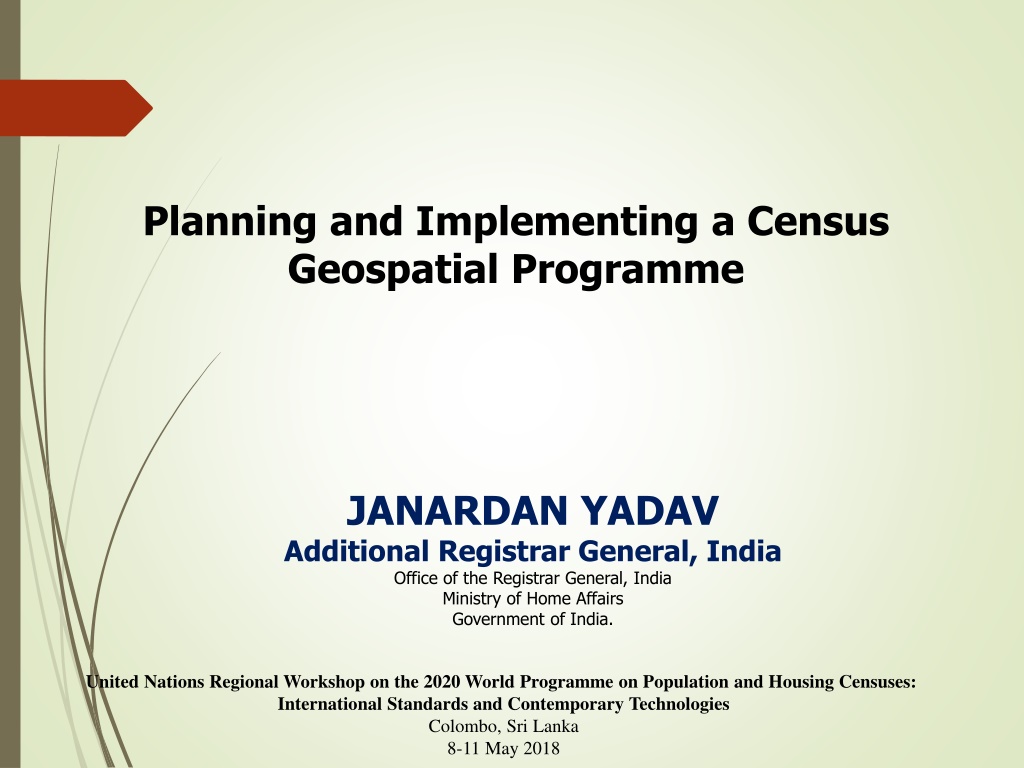
Planning and Implementing a Census Geospatial Programme JANARDAN YADAV Additional Registrar General, India Office of the Registrar General, India Ministry of Home Affairs Government of India. United Nations Regional Workshop on the 2020 World Programme on Population and Housing Censuses: International Standards and Contemporary Technologies Colombo, Sri Lanka 8-11 May 2018
Indian Census is largest administrative exercise in the world. India has the second largest population in the world. India has 2.4% of Worlds Surface Area of the world The enumerators number is more than the population of many countries of the world.. India is multiethnic, multilingual and multicultural society. In India, census is much more than mere head count of the population. It gives a snap shot of economic, social and cultural profile of the country.
Challenges Vast & Diverse Provinces/States - 35 Districts - 640 Sub-districts - 5,924 Towns/Cities - 7,933 Villages - 640,930 Enumeration Areas (In million) - 2.47 Households (in million) 249 Population (in million) 1,211 Enumerators & Supervisors (in million) 2.7 Ethnic groups - 4,635 Mother tongues 6,661
Challenges Vast & diverse (contd.) 5.4 Million Instruction Manuals printed in 18 languages 340 Million Census Schedules printed in 16 languages Materials moved to and from about 17,500 addresses across India
Methodology adopted during Census 2011 Preparation of unambiguous list of Administrative Units : Freezing of administrative boundaries. Finalization of Rural Urban Frame Assigning of location codes to various Administrative Units Carving Out the Enumeration Blocks(EBs) Data Users Conference Constitution of Technical Advisory Committee(TAC) for Finalization of Questionnaires Contd .
Census of India 2011 1st Phase: Houselisting & Housing Census (30 days) Population Register (15 days) During April to September 2010 2nd Phase: Population Enumeration (20 days) (From 9th to 28th February 2011) Face to Face or Canvasser method Paper Questionnaire
The socio-cultural, demographic and economic profile can be disseminated by way of data products. The purpose is to understand the indicators and their national distribution using thematic maps. This kind of thematic presentation is very helpful for the planning and implementation of various government programme initiatives. Some of the social indicators which were collected during the Census 2011 are presented here.
SOURCE OF DRINKING WATER Main Sources of Drinking Water (in percent) 3.48 0 0 0 8.48 31.97 33.48 11.57 1.58 9.44 Tap (treated) Tap (untreated) Covered Well Uncovered Well Hand pump Tube well / Borehole Others Number of Households (in crore) Sources Percentage 1. Tap: 10.74 43.5 (a) From treated sources 7.89 32.0 (b) From un-treated sources 2.85 11.6 2. Well 2.72 11.0 (a) Covered well 0.38 1.6 (b) Un-covered well 2.33 9.4 3. Hand pump 8.25 33.5 4. Tube well / Borehole 2.09 8.5 5.All others 0.86 3.5
MAIN SOURCE OF LIGHTING TOTAL Households (in crore) Source of lighting Percentage Electricity 16.58 67.3 Kerosene 7.75 31.4 Solar energy 0.11 0.4 Other Oil 0.05 0.2 Any Other 0.05 0.2 No lighting 0.11 0.5
LATRINE WITHIN PREMISES Number of Households (in crore) HHs having latrine facility within premises (%) Sources Have latrine facility 11.57 100.0 a. Flush/ pour flush connected to 8.99 77.6 b. Pit latrine 2.33 20.0 c. Night soil disposed into open drain 0.13 1.1 d. Service latrine 0.13 1.1
HOUSEHOLDS POSSESSING COMPUTER/LAPTOP Mode of Communication Assets Total Rural Urban 9.5 5.2 Computer: 18.7 3.1 0.7 Computer/Laptop - With Internet 8.3 6.4 4.5 Computer/Laptop - Without Internet 10.4
Census of India 2021: Way Forward Canvasser method to continue National Population Database to be used: As frame for Census 2021 To pre-populate the questionnaire to minimize workload Possibilities for using digital devices during data collection Mobile/Internet penetration Geo-referenced maps for data collection in cities: Vertical growth Horizontal growth
Thank you .. For more information please visit: censusindia.gov.in Our Census, Our Future 13


")