Analysis of Kidney Transplant Trends in End-Stage Renal Disease Patients (1996-2013)
This report delves into the trends surrounding kidney transplants in end-stage renal disease (ESRD) patients from 1996 to 2013. It looks at the percentage of dialysis patients wait-listed, unadjusted kidney transplant rates, number of patients wait-listed for kidney transplants, transplant counts, patients with functioning transplants, incident patients receiving transplants, and mortality rates for patients on transplant waiting lists. The data provides valuable insights into the transplantation landscape for ESRD patients during this period.

Download Presentation

Please find below an Image/Link to download the presentation.
The content on the website is provided AS IS for your information and personal use only. It may not be sold, licensed, or shared on other websites without obtaining consent from the author. Download presentation by click this link. If you encounter any issues during the download, it is possible that the publisher has removed the file from their server.
E N D
Presentation Transcript
2015 ANNUAL DATA REPORT VOLUME 2: END-STAGE RENAL DISEASE Chapter 7: Transplantation
Figure 7.1 Percentage of dialysis patients wait-listed and unadjusted kidney transplant rates, 1996-2013 Data Source: Reference Tables E4 and E9. Percentage of dialysis patients on the kidney waiting list is for all dialysis patients. Unadjusted transplant rates are for all dialysis patients. Abbreviations: Tx, transplant; pt yrs, patient years. Vol 2, ESRD, Ch 7 2
Figure 7.2 Number of patients wait-listed for kidney transplant, 1996-2013, and waiting time, 1996-2010 Data Source: Reference Tables E2 and E3. Waiting list counts include all candidates listed for a kidney transplant on December 31 of each year. Waiting time is calculated for all candidates enrolled on the waiting list in a given year. Vol 2, ESRD, Ch 7 3
Figure 7.3 Number of kidney transplants, 1996-2013 Data Source: Reference Tables E8, E8(2), and E8(3). Counts of transplants are for all dialysis patients. Vol 2, ESRD, Ch 7 4
Figure 7.4 Number of patients with a functioning kidney transplant, 1996-2013 Data Source: Reference Table D9. Prevalent counts of patients with a functioning kidney transplant as of December 31 of each year. Vol 2, ESRD, Ch 7 5
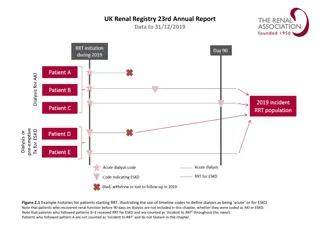
Figure 7.5 Percentage of incident patients being wait-listed or receiving a kidney transplant within one year of ESRD initiation, by age, 1996-2012 Data Source: Reference Table E5(2). Waiting list or transplantation among incident ESRD patients by age (0-74 years). Vol 2, ESRD, Ch 7 6
Figure 7.6 Annual mortality rates for dialysis patients on the kidney transplant waiting list by time on the list, 1996-2013 Data Source: Reference Table H6. Annual mortality rates of dialysis patients on the kidney transplant waiting list per 1,000 dialysis patient years at risk, by patient vintage. Abbreviation: pt yrs, patient years. Vol 2, ESRD, Ch 7 7
Table7.1 Unadjusted kidney transplant rates, all donor types, by age, sex, race, and primary cause of ESRD, per 100 dialysis patient years, 2004-2013 Age 0-21 22-44 45-64 65-74 75 and up Sex Male Female Race White Black/African American Native American Asian Primary Cause of ESRD Diabetes Hypertension Glomerulonephritis All 2004 31.2 11.6 6.1 2.3 0.2 2005 34.9 11.2 6.0 2.6 0.3 2006 35.4 10.8 6.0 2.7 0.3 2007 30.3 10.1 5.6 2.5 0.4 2008 30.9 9.2 5.3 2.6 0.3 2009 33.3 9.3 5.1 2.6 0.4 2010 31.5 8.7 5.0 2.6 0.4 2011 30.5 8.3 4.8 2.6 0.4 2012 31.2 8.2 4.4 2.5 0.4 2013 30.4 7.9 4.5 2.5 0.3 5.6 4.5 5.6 4.5 5.6 4.3 5.1 4.1 4.9 3.8 4.7 3.9 4.5 3.7 4.3 3.5 4.1 3.3 4.0 3.3 6.2 3.2 3.7 5.4 6.1 3.3 3.3 5.5 6.0 3.3 3.9 5.3 5.6 3.1 3.0 4.8 5.2 3.0 3.6 5.0 5.0 3.0 3.7 4.6 4.7 3.0 3.0 4.7 4.5 2.9 3.2 4.4 4.3 2.6 2.7 4.5 4.2 2.6 2.4 4.5 3.4 3.1 10.2 5.1 3.4 3.2 9.7 5.1 3.2 3.2 9.9 5.0 3.0 3.1 9 4.7 2.9 2.9 8.7 4.4 2.8 2.9 8.7 4.3 2.6 2.8 8.8 4.1 2.5 2.6 8.3 4.0 2.3 2.6 7.9 3.7 2.3 2.5 7.7 3.7 Data Source: Reference Table E9. Vol 2, ESRD, Ch 7 8
Figure 7.7 Number of deceased donor transplants and unadjusted transplant rates among deceased donor kidney recipients, by recipient age, 1996-2013 (a)Number of transplants by age Data Source: Reference Table E8(2). Deceased donor kidney transplant counts by recipient age. Vol 2, ESRD, Ch 7 9
Figure 7.7 Number of deceased donor transplants and unadjusted transplant rates among deceased donor kidney recipients, by recipient age, 1996-2013 (b) Transplant rates by age Data Source: Reference Table E9(2). Unadjusted deceased donor kidney transplant rates by recipient age. Abbreviation: pt, patient. Vol 2, ESRD, Ch 7 10
Figure 7.8 Number of deceased donor transplants and unadjusted transplant rates among deceased donor kidney recipients, by recipient sex, 1996-2013 (a)Number of transplants by sex Data Source: Reference Table E8(2). Deceased donor kidney transplant counts by recipient sex. Vol 2, ESRD, Ch 7 11
Figure 7.8 Number of deceased donor transplants and unadjusted transplant rates among deceased donor kidney recipients, by recipient sex, 1996-2013 (b)Transplant rates by sex Data Source: Reference Table E9(2). Unadjusted deceased donor kidney transplant rates by recipient sex. Abbreviation: pt yrs, patient years. Vol 2, ESRD, Ch 7 12
Figure 7.9 Number of deceased donor transplants and unadjusted transplant rates among deceased donor kidney recipients, by recipient race, 1996-2013 (a)Number of transplants by race Data Source: Reference Table E8(2). Deceased donor kidney transplant counts by recipient race. Abbreviations: Blk/Af Am, Black/African American; Native Am, Native American. Vol 2, ESRD, Ch 7 13
Figure 7.9 Number of deceased donor transplants and unadjusted transplant rates among deceased donor kidney recipients, by recipient race, 1996-2013 (b)Transplant rates by race Data Source: Reference Table E9(2). Unadjusted deceased donor kidney transplant rates by recipient race. Abbreviations: Blk/Af Am, Black/African American; Native Am, Native American; pt, patient. Vol 2, ESRD, Ch 7 14
Figure 7.10 Number of deceased donor transplants and unadjusted transplant rates among deceased donor kidney recipients, by recipient primary cause of ESRD, 1996-2013 (a)Number of transplants by primary cause of ESRD Data Source: Reference Table E8(2). Deceased donor kidney transplant counts by recipient primary cause of ESRD. Abbreviations: DM, diabetes mellitus; ESRD, end-stage renal disease; GN, glomerulonephritis; HTN, hypertension. Vol 2, ESRD, Ch 7 15
Figure 7.10 Number of deceased donor transplants and unadjusted transplant rates among deceased donor kidney recipients, by recipient primary cause of ESRD, 1996-2013 (b)Transplant rates by primary cause of ESRD Data Source: Reference Table E9(2). Unadjusted deceased donor kidney transplant rates by recipient primary cause of ESRD. Abbreviations: DM, diabetes mellitus; ESRD, end-stage renal disease; GN, glomerulonephritis; HTN, hypertension; pt, patient. Vol 2, ESRD, Ch 7 16
Figure 7.11 Number of living donor transplants and unadjusted transplant rates among living donor kidney recipients, by recipient age, 1996-2013 (a)Number of transplants by age Data Source: Reference Table E8(3). Living donor kidney transplant counts by recipient age. Vol 2, ESRD, Ch 7 17
Figure 7.11 Number of living donor transplants and unadjusted transplant rates among living donor kidney recipients, by recipient age, 1996-2013 (b)Transplant rates by age Data Source: Reference Table E9(3). Unadjusted living donor kidney transplant rates by recipient age. Abbreviation: pt, patient. Vol 2, ESRD, Ch 7 18
Figure 7.12 Number of living donor transplants and unadjusted transplant rates among living donor kidney recipients, by recipient sex, 1996-2013 (a)Number of transplants by sex Data Source: Reference Table E8(3). Living donor kidney transplant counts by recipient sex. Vol 2, ESRD, Ch 7 19
Figure 7.12 Number of living donor transplants and unadjusted transplant rates among living donor kidney recipients, by recipient sex, 1996-2013 (b)Transplant rates by sex Data Source: Reference Table E9(3). Unadjusted living donor kidney transplant rates by recipient sex. Abbreviation: pt yrs, patient years. Vol 2, ESRD, Ch 7 20
Figure 7.13 Number of living donor transplants and unadjusted transplant rates among living donor kidney recipients, by recipient race, 1996-2013 (a)Number of transplants by race Data Source: Reference Table E8(3). Living donor kidney transplant counts by recipient race. Abbreviations: Blk/Af Am, Black/African American; Native Am, Native American. Vol 2, ESRD, Ch 7 21
Figure 7.13 Number of living donor transplants and unadjusted transplant rates among living donor kidney recipients, by recipient race, 1996-2013 (b)Transplant rates by race Data Source: Reference Table E9(3). Unadjusted living donor kidney transplant rates by recipient race. Abbreviations: Blk/Af Am, Black/African American; Native Am, Native American; pt, patient. Vol 2, ESRD, Ch 7 22
Figure 7.14 Number of living donor transplants and unadjusted transplant rates among living donor kidney recipients, by recipient primary cause of ESRD, 1996-2013 (a)Number of transplants by primary cause of ESRD Data Source: Reference Table E8(3). Living donor kidney transplant counts by recipient primary cause of ESRD. Abbreviations: DM, diabetes mellitus; ESRD, end-stage renal disease; GN, glomerulonephritis; HTN, hypertension. Vol 2, ESRD, Ch 7 23
Figure 7.14 Number of living donor transplants and unadjusted transplant rates among living donor kidney recipients, by recipient primary cause of ESRD, 1996-2013 (b)Transplant rates by primary cause of ESRD Data Source: Reference Table E9(3). Unadjusted living donor kidney transplant rates by recipient primary cause of ESRD. Abbreviations: DM, diabetes mellitus; ESRD, end-stage renal disease; GN, glomerulonephritis; HTN, hypertension; pt, patient. Vol 2, ESRD, Ch 7 24
Figure 7.15 Number of deceased kidney donors and unadjusted kidney donation rates, by donor age, 1999-2013 (a)Number of donors by age Data Source: Data on the annual number of deaths in the US population are obtained from the Centers for Disease Control and Prevention; the deceased donor data are obtained from UNOS. Deceased donor kidney donation rates by donor age. Vol 2, ESRD, Ch 7 25
Figure 7.15 Number of deceased kidney donors and unadjusted kidney donation rates, by donor age, 1999-2013 (b)Donation rates by age Data Source: Data on the annual number of deaths in the US population are obtained from the Centers for Disease Control and Prevention; the deceased donor data are obtained from UNOS. Deceased donor kidney donation rates by donor age. Vol 2, ESRD, Ch 7 26
Figure 7.16 Number of deceased kidney donors and unadjusted kidney donation rates, by donor sex, 1999-2013 (a)Number of donors by sex Data Source: Data on the annual number of deaths in the US population are obtained from the Centers for Disease Control and Prevention; the deceased donor data are obtained from UNOS. Deceased donor kidney donation rates by donor sex. Vol 2, ESRD, Ch 7 27
Figure 7.16 Number of deceased kidney donors and unadjusted kidney donation rates, by donor sex, 1999-2013 (b)Donation rates by sex Data Source: Data on the annual number of deaths in the US population are obtained from the Centers for Disease Control and Prevention; the deceased donor data are obtained from UNOS. Deceased donor kidney donation rates by donor sex. Vol 2, ESRD, Ch 7 28
Figure 7.17 Number of deceased kidney donors and unadjusted kidney donation rates, by donor race, 1999-2013 (a)Number of donors by race Data Source: The US death population data are obtained from the Centers for Disease Control and Prevention; the deceased donor data are obtained from UNOS. Deceased donor kidney donation rates by donor race. Abbreviations: Asian/Pac, Asian/Pacific Islander; Blk/Af Am, Black/African American; Native Am, Native American. Vol 2, ESRD, Ch 7 29
Figure 7.17 Number of deceased kidney donors and unadjusted kidney donation rates, by donor race, 1999-2013 (b)Donationrates by race Data Source: The US death population data are obtained from the Centers for Disease Control and Prevention; the deceased donor data are obtained from UNOS. Deceased donor kidney donation rates by donor race. Abbreviations: Asian/Pac, Asian/Pacific Islander; Blk/Af Am, Black/African American; Native Am, Native American. Vol 2, ESRD, Ch 7 30
Table 7.2Trend in 1-, 5-, & 10-year deceased donor kidney transplant outcomes, 1996-2012 One year post-transplant Prob. of all- cause graft failure transplant Five years post-transplant Prob. of all- cause graft failure transplant Ten years post-transplant Prob. of all- cause graft failure transplant Prob. of return to dialysis or repeat Prob. of death Prob. of return to dialysis or repeat Prob. of death Prob. of return to dialysis or repeat Prob. of death Year 1996 1997 1998 1999 2000 2001 2002 2003 2004 2005 2006 2007 2008 2009 2010 2011 2012 14.3% 12.9% 12.8% 13.7% 13.2% 12.2% 12.3% 12.1% 11.5% 11.4% 10.8% 9.7% 9.5% 9.5% 9.0% 7.6% 7.6% 10.2% 8.5% 9.2% 9.2% 8.6% 8.0% 8.3% 7.6% 7.3% 7.1% 7.0% 6.2% 6.2% 5.7% 5.6% 4.6% 4.6% 5.8% 6.2% 5.5% 5.9% 6.4% 5.7% 5.8% 5.7% 5.5% 6.0% 5.2% 4.7% 4.4% 5.0% 4.5% 3.9% 3.8% 36.2% 34.7% 33.8% 34.0% 34.6% 33.3% 33.0% 32.1% 31.7% 30.2% 29.6% 28.5% 26.9% 25.7% 23.7% 24.0% 23.1% 23.1% 21.4% 22.2% 20.6% 20.8% 19.3% 18.9% 17.9% 16.2% 19.4% 19.2% 18.1% 18.9% 19.7% 19.9% 18.9% 18.6% 18.4% 18.0% 17.3% 16.9% 16.3% 59.1% 58.1% 56.8% 56.8% 57.3% 55.8% 54.1% 54.9% 42.9% 40.8% 40.4% 39.4% 39.1% 37.0% 36.2% 36.1% 39.3% 39.6% 38.1% 38.4% 39.3% 38.7% 37.4% 37.9% Data Source: Reference Tables F2, F14, I26; F5, F17, I29; F6, F18, I30. Outcomes among recipients of a first-time deceased donor kidney transplant; unadjusted. Abbreviations: Prob., probability. Vol 2, ESRD, Ch 7 31
Table 7.3Trend in 1-, 5-, & 10-year living donor kidney transplant outcomes, 1996-2012 One year post-transplant Prob. of all- cause graft failure transplant Five years post-transplant Prob. of all- cause graft failure transplant Ten years post-transplant Prob. of all- cause graft failure transplant Prob. of return to dialysis or repeat Prob. of death Prob. of return to dialysis or repeat Prob. of death Prob. of return to dialysis or repeat Prob. of death Year 6.9% 6.7% 6.0% 6.1% 6.6% 6.2% 5.8% 5.4% 5.2% 5.3% 4.4% 3.8% 4.1% 3.9% 3.5% 3.4% 3.2% 5.2% 4.8% 4.4% 4.3% 4.6% 4.1% 3.9% 3.9% 3.5% 3.7% 3.0% 2.4% 2.7% 2.6% 2.2% 2.2% 1.9% 2.3% 2.7% 2.3% 2.2% 2.6% 2.5% 2.5% 1.9% 2.1% 2.0% 1.7% 1.4% 1.6% 1.4% 1.4% 1.9% 1.5% 22.9% 22.2% 20.9% 20.8% 21.9% 21.3% 20.5% 20.1% 18.8% 18.7% 16.8% 16.6% 15.3% 16.8% 15.8% 14.6% 14.7% 14.9% 14.3% 13.6% 13.8% 12.7% 12.6% 11.1% 10.5% 9.9% 9.6% 10.5% 10.0% 9.6% 10.6% 10.2% 10.3% 9.5% 8.8% 8.8% 8.1% 8.0% 7.5% 43.3% 43.2% 42.4% 41.2% 42.2% 41.2% 40.0% 39.6% 32.4% 31.1% 30.6% 29.0% 29.1% 27.8% 26.2% 26.1% 22.7% 24.4% 23.4% 22.7% 24.0% 24.0% 24.6% 23.3% 1996 1997 1998 1999 2000 2001 2002 2003 2004 2005 2006 2007 2008 2009 2010 2011 2012 Data Source: Reference Tables F8, F20, I32; F11, F23, I35; F12, F24, I36. Outcomes among recipients of a first-time living donor kidney transplant; unadjusted. Abbreviations: Prob., probability. Vol 2, ESRD, Ch 7 32
Figure 7.18 Acute rejection within the first year post-transplant for kidney transplant recipients, 1996-2013 Data Source: Special analyses, USRDS ESRD Database. Acute rejection rates during the first year post-transplant for recipients age 18 and older with a functioning graft at discharge. Vol 2, ESRD, Ch 7 33