Sustainable Development Modelling Tools at ICTP Trieste
In June 2017, a Summer School on Modelling Tools for Sustainable Development was organized at ICTP, Trieste. The sessions covered topics like representation of water supply and demand, incorporation of land use in modelling, energy system diagrams, and structures of energy and water systems models. Participants explored different technologies and their interrelations in terms of inputs and outputs, emphasizing the importance of sustainable development practices.

Download Presentation

Please find below an Image/Link to download the presentation.
The content on the website is provided AS IS for your information and personal use only. It may not be sold, licensed, or shared on other websites without obtaining consent from the author. Download presentation by click this link. If you encounter any issues during the download, it is possible that the publisher has removed the file from their server.
E N D
Presentation Transcript
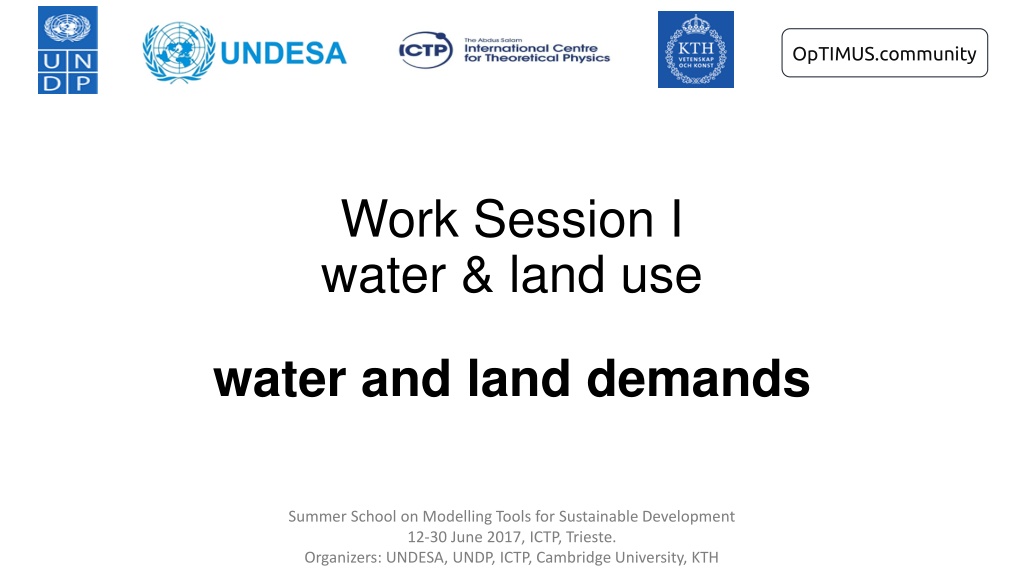
https://lh6.googleusercontent.com/Ly_PhcwOrV7ieHqPjBUUdqFiAGODtzJmBwrIeHLHNXmO2gAmLok-TdTBr_d3BtnUCDenebmvgE80MCYN8Vorq6tctapX-MHkCI-nBydPkMCIQlU3bY5E3A4URgaFKH9_3Y3ixC7nhttps://lh6.googleusercontent.com/Ly_PhcwOrV7ieHqPjBUUdqFiAGODtzJmBwrIeHLHNXmO2gAmLok-TdTBr_d3BtnUCDenebmvgE80MCYN8Vorq6tctapX-MHkCI-nBydPkMCIQlU3bY5E3A4URgaFKH9_3Y3ixC7n https://lh4.googleusercontent.com/jDjKyzhdhZWMxUNi7z6qAJzpBZEkOBbfd9pxc_hw_VhHxoTvuhQehahE7VFIlqmGgpn-yNdL2HsCN5L4vZpsZzJoIFrGq37CRI-kV8YM3EbnBWnbkWxvjk9tYWPG2bomkqh_um96 https://lh5.googleusercontent.com/QwAyBzI_HrdO1gj0yaFRi0OiqghV8sMirzKBHzFYtGIWVVnBeuDuBR9_JP1vo9XJKYzGCL0sd1ZodqNBZxjvOYILUxRDdlxRQLuJNl1PB5k_6S9avTsqb2zL8U1SbUj7jo_r0pHa OpTIMUS.community Work Session I water & land use water and land demands Summer School on Modelling Tools for Sustainable Development 12-30 June 2017, ICTP, Trieste. Organizers: UNDESA, UNDP, ICTP, Cambridge University, KTH
Session Overview 1. Representation of water supply and demand 2. 3. Incorporation of land use in the CLEW model Overview of water, land use technologies and of their inter-relations in terms of inputs and outputs Differentiating water, land use, climate and energy technologies : parameters used and their meaning units used in the model (parameters and variables) Input and output activity ratios 4. Summer School on Modelling Tools for Sustainable Development 12-30 June 2017, ICTP, Trieste. Organizers: UNDESA, UNDP, ICTP, Cambridge University, KTH 9/26/2024 2
Energy system diagram Note that interactions with water and land use technologies and commodities is not included in this diagram. Summer School on Modelling Tools for Sustainable Development 12-30 June 2017, ICTP, Trieste. Organizers: UNDESA, UNDP, ICTP, Cambridge University, KTH 9/26/2024 3
energy sector model structure Final energy demand Energy Transformation Primary Energy Supply Agricultural sector Fuel demand Fossil fuels Domestic extraction Electricity Power sector Fuel demand Commercial sector Renewable fuels Renewable resources Refined products Fuel demand Industrial sector Oil Refinery Fuel demand Residential sector Fuels Energy imports Renewable fuels Biofuel production Fuel demand Transport sector Fuels Energy exports Summer School on Modelling Tools for Sustainable Development 12-30 June 2017, ICTP, Trieste. Organizers: UNDESA, UNDP, ICTP, Cambridge University, KTH 9/26/2024 4
water systems model structure supply final demand Precipitation Surface water (rivers, lakes, reservoirs) Groundwater (aquifers) Seawater desalination Domestic supply Agriculture / irrigation Industry Power sector cooling Environmental services Summer School on Modelling Tools for Sustainable Development 12-30 June 2017, ICTP, Trieste. Organizers: UNDESA, UNDP, ICTP, Cambridge University, KTH 9/26/2024 5
CLEW template model: diagram of the water & land use representation Summer School on Modelling Tools for Sustainable Development 12-30 June 2017, ICTP, Trieste. Organizers: UNDESA, UNDP, ICTP, Cambridge University, KTH
CLEW template model: water system Standardized model structure Customizable to country data Structure customizable for country water flows and account for climate variability Water system represented in a compact manner Simplified water demand representation demand projections based on selected drivers demand represented by sector, and, for residential supply split between urban and rural Simplified water availability and supply representation Diverse source expressed as a single entity
Water system in the model structure: inputs & outputs Water supply Final Water demand Water extraction Industrial sector water demand precipitation Annual Precipitation Surface water pumping Surface water Water demand Commercial sector Groundwater recharge Water demand Residential Rural sector Groundwater Irrigation & sectoral water Groundwater pumping Residential Urban sector Water demand Run-off Surface water Surface water Water demand Environmental Flow
Final water demands in the template CLEW model This sector refers to self-supplied industries not connected to the public distribution network. Water used by industries connected to the network is included in commercial. Industrial sector water demand Interpreted as the result from the municipal water demand without the residential component. Data in AQUASTAT was aggregated to municipal. Water demand Commercial sector Water demand Residential Rural sector Water demand specific to the settlement type that originates from the daily average water consumption per capita. Residential Urban sector Water demand Water demand Environmental Flow Considered to represent 10% of the annual value of average precipitation. It is an assumption that can be manipulated. Summer School on Modelling Tools for Sustainable Development 12-30 June 2017, ICTP, Trieste. Organizers: UNDESA, UNDP, ICTP, Cambridge University, KTH 9/26/2024 9
Endogenous water demands in the template CLEW model Water demand that indirectly results from the amount of water involved in the evapotranspiration process. If a crop is rain-fed, it only uses water from precipitation. If a crop is irrigated, apart from precipitation, water is provided by surface and / or groundwater. Agricultural water demand Endogenous water demand Evapotranspiration precipitation Crop 1 Rainfed Ground Water Recharge Surface water pumping Crop 2 irrigated Runoff irrigation Groundwater pumping Summer School on Modelling Tools for Sustainable Development 12-30 June 2017, ICTP, Trieste. Organizers: UNDESA, UNDP, ICTP, Cambridge University, KTH 9/26/2024 10
Water demands Commercial water demand COMWAT: Water used in the commercial sector COMELEC: Electricity used in the commercial sector DEMCOMWAT : Water used in commercial sector WATNAG: Water for Non Agricultural purposes Surface water Summer School on Modelling Tools for Sustainable Development 12-30 June 2017, ICTP, Trieste. Organizers: UNDESA, UNDP, ICTP, Cambridge University, KTH 9/26/2024 11
Water demands Industrial water demand INDWAT: Water used in the industrial sector COMELEC: Electricity used in the commercial sector DEMINDWAT : Water used in commercial sector WATNAG: Water for Non Agricultural purposes WATSUR: Surface water Summer School on Modelling Tools for Sustainable Development 12-30 June 2017, ICTP, Trieste. Organizers: UNDESA, UNDP, ICTP, Cambridge University, KTH 9/26/2024 12
Water demands Power Sector water demand COMELEC: Electricity used in the commercial sector DEMPWRWAT : Water used in commercial sector PWRWAT: Water used in the Power sector WATNAG: Water for Non Agricultural purposes Summer School on Modelling Tools for Sustainable Development 12-30 June 2017, ICTP, Trieste. Organizers: UNDESA, UNDP, ICTP, Cambridge University, KTH 9/26/2024 13
Water demands Transformation Sector water demand COMELEC: Electricity used in the commercial sector UPSWAT: Water used in the transformation sector DEMUPSWAT : Water used in transformation sector WATNAG: Water for Non Agricultural purposes Summer School on Modelling Tools for Sustainable Development 12-30 June 2017, ICTP, Trieste. Organizers: UNDESA, UNDP, ICTP, Cambridge University, KTH 9/26/2024 14
Water demands Rural Residential water demand RESWATR: Rural Residential water demand WATNAG: Water for Non Agricultural purposes DEMRESWAT1 : Water used in Residential sector Rural WATSUR: Surface water Summer School on Modelling Tools for Sustainable Development 12-30 June 2017, ICTP, Trieste. Organizers: UNDESA, UNDP, ICTP, Cambridge University, KTH 9/26/2024 15
Water demands Urban Residential water demand DEMRESWAT2 : Water used in Residential sector Rural RESWATU: Urban Residential water demand COMELEC: Electricity used in the commercial sector WATNAG: Water for Non Agricultural purposes WATSUR: Surface water Summer School on Modelling Tools for Sustainable Development 12-30 June 2017, ICTP, Trieste. Organizers: UNDESA, UNDP, ICTP, Cambridge University, KTH 9/26/2024 16
Water demands Urban Residential water demand WATENV001 : Water environmental flows WATSUR: Surface water WATENV: Environmental water flows Summer School on Modelling Tools for Sustainable Development 12-30 June 2017, ICTP, Trieste. Organizers: UNDESA, UNDP, ICTP, Cambridge University, KTH 9/26/2024 17
CLEW template model: land use system Standardized model structure Customizable to country data (land shares and crop selection) Structure customizable to represent a selected number of land classes (up to 3 cultivated land classes, subject to different water use) Simplified demand representation of land use and agriculture production Production from selected crops driven by different factors (e.g. crop consumption per capita) Simplified crop production representation based on water availability and climate Consideration of rain-fed and irrigated crops and difference in yields
Land classes in the template CLEW model Forests Land Other land Land used permanently (for a period of five years or more) for herbaceous forage crops, either cultivated or naturally growing. Pastures & Meadows Agricultural land Crop 1 rain-fed Crop 1 irrigated Representation of 3 crops (rain-fed & irrigated) Includes arable land and permanent crops Crop 4 other crops Summer School on Modelling Tools for Sustainable Development 12-30 June 2017, ICTP, Trieste. Organizers: UNDESA, UNDP, ICTP, Cambridge University, KTH 9/26/2024 19
Land use representations Crop1 Irrigated Crop1 Rain fed Agricultural Land Stock Crop2 Irrigated Crop2 Rain fed Land Resource Forests Crop3 Irrigated Crop3 Rain fed Crop4 Irrigated Other Land (includes built up areas) Crop4 Rain fed Permanent Meadows and Pastures Summer School on Modelling Tools for Sustainable Development 12-30 June 2017, ICTP, Trieste. Organizers: UNDESA, UNDP, ICTP, Cambridge University, KTH 9/26/2024 20
Land use representations Rain fed Crop Diesel used in agriculture Gasoline used in agriculture Evapotranspiration Energy inputs Ground Water Recharge water outputs Rainfed Crop LPG used in agriculture Runoff Water from Precipitation water inputs Crop Yield Land Resource land output land inputs Summer School on Modelling Tools for Sustainable Development 12-30 June 2017, ICTP, Trieste. Organizers: UNDESA, UNDP, ICTP, Cambridge University, KTH 9/26/2024 21
Land use representations Irrigated Crop Diesel used in agriculture Gasoline used in agriculture Evapotranspiration Energy inputs Ground Water Recharge water outputs LPG used in agriculture Irrigated Crop Water from Irrigation Runoff water inputs Water from Precipitation Crop Yield land output Land Resource Land inputs Summer School on Modelling Tools for Sustainable Development 12-30 June 2017, ICTP, Trieste. Organizers: UNDESA, UNDP, ICTP, Cambridge University, KTH 9/26/2024 22
ENERGY: List of sectors, commodities and abbreviations Sector name Sector abbreviation Commodity name Commodity abbreviation Commodity name Commodity abbreviation Agriculture AGR Biomass BIO Kerosene KER Commerce COM Charcoal CHC Liquid petroleum gas LPG Industry IND Coal COA Natural gas NGS Power PWR Crude oil CRU Other hydro carbons OHC Residential RES Diesel DSL Petroleum coke PCK Transformation UPS Geothermal GEO Solar energy SOL Transport TRA Gasoline GSL Uranium URN Heat HET Waste WAS Fuel Oil HFO Wind energy WND Hydro HYD Notable exception: Electricity before transmission (ELC001) and after transmission (ELC002)
Water and Land Use: List of sectors, commodities and abbreviations Sector name Sector abbreviation Commodity name Commodity abbreviation Commodity name Commodity abbreviation Water used in power sector Water used in residential sector rural Water used in residential sector urban Water used in transformation sector Agriculture AGR WATSUR Surface water PWRWAT Water used in agriculture Commerce COM AGRWAT RESWATR agriculture electricity demand (includes fishing) Electricity used in the commercial sector Water for non- agricultural uses Water used in commercial sector Water used in industrial sector Industry IND AGRELC RESWATU Power PWR COMELC UPSWAT Residential RES WATNAG LND Land COMWAT LNDAGR Agricultural land Diesel used in agriculture INDWAT AGRDSL
Water and Land Use: List of sectors, commodities and abbreviations Commodity name Commodity abbreviation Gasoline used in agriculture LPG used in agriculture Commodity name Commodity abbreviation AGRGSL CRP002 Crop 2 AGRLPG CRP003 Crop 3 WATPRC Precipitation water CRP004 Crop 4 WATEVT Evapotranspiration LNDFOR Forested land Groundwater recharge Permanent meadows and pastures WATGRD LNDMPA WATRUN Runoff water LNDOTH Other land Environmental water flow CRP001 Crop 1 WATENV
Hydrological cycle Source: California Ag Water Stewardship Initiative 26
Example Example - Water balance in a maize field Inputs Outputs Precipitation Groundwater Irrigation Runoff Evapo- transpiration Crop production Energy 27
Example Example Material flows in a maize field Let s take the example of 1 kha of irrigated corn field. During a period of one year, the farmer estimated the following flows on this piece of land. In terms of water inputs: 18.3 million m3 as precipitation and 5.4 million m3 as irrigation. In terms of water outputs 16.7 million m3 are lost as evapotranspiration, 3 million m3 to groundwater reservoirs and 4 million m3 as runoff. Energy requirements to operate various pieces of machinery include: 228 GJ of diesel, 24 GJ of gasoline and 25 GJ of LPG. Finally, the annual crop yield of this land amounts to 2,080 tonnes of maize. 28
Example Example Material flows in a maize field Water Inputs 18.3 million m3 as precipitation 5.4 million m3 as irrigation 1000 ha of land Water Outputs 16.7 million m3 as ET 3 million m3 to groundwater 4 million m3 as runoff Energy Inputs 228 GJ diesel Crop Yield 24 GJ gasoline 2,080 tonnes of maize 25 GJ LPG 29
CLEW template model: diagram of the water & land use representation Summer School on Modelling Tools for Sustainable Development 12-30 June 2017, ICTP, Trieste. Organizers: UNDESA, UNDP, ICTP, Cambridge University, KTH