Mastering the Art of Investing: Episode 7 - Avoiding Noise with Sandeep Tyagi
Successful investing requires avoiding distractions and emotional responses to market fluctuations. Sandeep Tyagi discusses the impact of noise on investment decisions, highlights the emotional roller-coaster that investors often face, and provides strategies to steer clear of noise for better returns.

Download Presentation

Please find below an Image/Link to download the presentation.
The content on the website is provided AS IS for your information and personal use only. It may not be sold, licensed, or shared on other websites without obtaining consent from the author. Download presentation by click this link. If you encounter any issues during the download, it is possible that the publisher has removed the file from their server.
E N D
Presentation Transcript
Minimalist Art of Investing Ep 7: Avoiding Noise Sandeep Tyagi
Recap: First Six Episodes Difficult to predict one year returns, easier to predict over long periods 10 Year Rolling returns: Sensex gave 11.2% CAGR, FD gave 8.2% CAGR 60-40 model portfolio has 10.76% average returns Savings rate of 25 to 40% is healthy Investment Planning for 3 big goals (Templates provided on Gulaq.com): Retirement Planning Buying a home children education Gear based investing: Take risk survey and find out your risk appetite Get any gear by mixing only two ingredients: Equity and Fixed income Active vs Passive investing: Figure out what kind of investor you are
OFFER FOR FREE CONSULTATION Follow us on social me dia Tag us Make a re que st F O LLO W U S O N Sandeep Tyagi GULAQ LinkedIn: https://www.linkedin.com/in/styagi/ LinkedIn: https://www.linkedin.com/in/gulaqnew Twitter: https://twitter.com/styagi Twitter: https://twitter.com/gulaqfintech Instagram: https://www.instagram.com/gulaqfintech/
What is Noise? The major problem with disciplined investing lies in implementation. Investors get distracted by emotional aspects, tons of information availability on fingertips, etc. Internal noise External noise
Emotional Roller-coaster We have met the enemy and he is us - Walt Kelly
How Noise impacts returns? Peter Lynch managed Magellan Fund from 1977 to 1990, which had $18 million in assets when he started, had grown to $14 billion by the time he resigned as the fund manager. Fund returns 29% CAGR According to Fidelity investments, the average Magellan fund investor lost money during Lynch s tenure. These investors underperformance is poor investment decisions driven by Noise. *Source: Quantified strategies
Avoiding Noise - Emotions You have invested in a stock at Rs. 100. You are expecting it to grow to 110 in one year. After 3 months, the stock is down to Rs. 90. What will you do? a) My stock picking is bad, I will exit at 90 b) I will wait till I recover loss, will exit at 100 c) Stock is cheap now, let me buy more d) Do nothing
Avoiding Noise - Availability Over emphasize on things that are readily available in our memory Gangnam style song release drive 800% increase in stock price of DI Corp The only link is DI Corp was led by the father of singer Psy Same is the case with huge popularity behind FAANG share prices
Avoiding Noise Loss Aversion People tend to fear a loss twice as much as they are likely to welcome an equivalent gain Pain from Rs. 100 Loss - Daniel Kahneman Pleasure from Rs. 100 Gain
Avoiding Noise Loss Aversion I shouldn t have withdrawn my investment. Is it a good time to invest? Stock is rallying. Invested. Thank god, I recovered my loss. I exit. Read about a stock. Lets track it for a while. Seems like stock is not a good buy, I will wait till I recover my loss.
Avoiding Noise Loss Aversion Loss aversion plays a key role in investing. People keep on holding their losing investments for much longer than they would otherwise. Chanchal and Parvat are brothers. They discuss about their stock investments regularly. The following is a scenario they have gone through loss aversion bias: Chanchal Parvat Bought the stock at Rs. 100 Planned to Buy the stock at Rs. 100, but forgot After a few days, stock gone down to 90 After a few days, stock gone down to 90 Feels the stock is not a good buy Got nervous, and felt the stock is not a good buy Doesn t want to sell, till he recovers loss So, he didn t buy
Chart indicators Newspapers, popular financial websites, social media platforms, even TikTok is filled with stock market advice. There were 100s of technical analysis articles published on popular financial platforms Proponents of chart indicators say that emotions drive markets and creates patterns They believe these chart patterns help in predicting market movement Ex: Golden Cross, Double Bottoms, etc. Can these technical indicators pattern help in predicting the stock market movement?
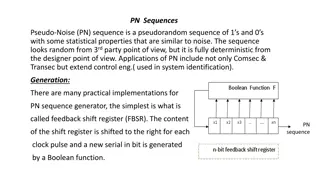
Chart indicators Golden cross Golden cross occurs when a short-term indicator crosses a long-term trend. Ex: Simple moving average
Chart indicators Golden cross We examined Golden cross across Nifty 50 securities. The following are the results during the period Jan 1, 2016, to June 30, 2022. Every time the market exhibited Golden cross, we took long position, and reversed when the reverse happened. Period of Evaluation 1/1/2016 30/06/2022 Number of completed Trades 514 Profitable Trades 205 Unprofitable Trades 309 Total profit over period 35% Nifty return over the period 108% *Nifty 50 securities Golden Cross Trades
Chart indicators Relative Strength indicator (RSI) RSI is a momentum indicator, uses average profit of periods with price increase and decrease in recent past to determine whether the stock is overbought or oversold. In this analysis we used 30% cutoff for buy signal and 70% for a sell. Period of Evaluation Jan 2016 June 2022 Number of completed Trades 45 Profitable Trades 25 Unprofitable Trades 20 Total profit over period -22.5% Nifty return over the period 108% *Nifty 50 securities RSI Trades
Chart indicators - Conclusion A technical indicator which relies on price and volume information alone does not produce good returns. There are 300+ factors which are identified for technical analysis. It s waste of time, spending time on these simple charts, indicators, etc.,
Chart indicators Moving Average Bollinger Bands Fibonacci Extensions Negative Volume Candlestick patterns MACD Percentage Price Volume Trend Golden Cross Median Price Simple moving average Exponential moving averages Multiple Moving Averages Stochastic oscillator Relative strength index Percentage Bands Stochastic RSI Linear Regression Price Ratio Accumulation Distribution MACD Oscillator TRIX Indicator ADX Momentum Chaikin Oscillator Value Directional Movement Growth Displaced Moving Average Low volatility *Source: Incrediblecharts.com
Coming Episode Avoiding Noise Part II - Sectoral investing - Market Timing
Thank You F O LLO W U S O N Sandeep Tyagi GULAQ LinkedIn: https://www.linkedin.com/in/styagi/ LinkedIn: https://www.linkedin.com/in/gulaqnew Twitter: https://twitter.com/styagi Twitter: https://twitter.com/gulaqfintech Instagram: https://www.instagram.com/gulaqfintech/


")