Prioritizing Invasive Species Management Efforts in New York State
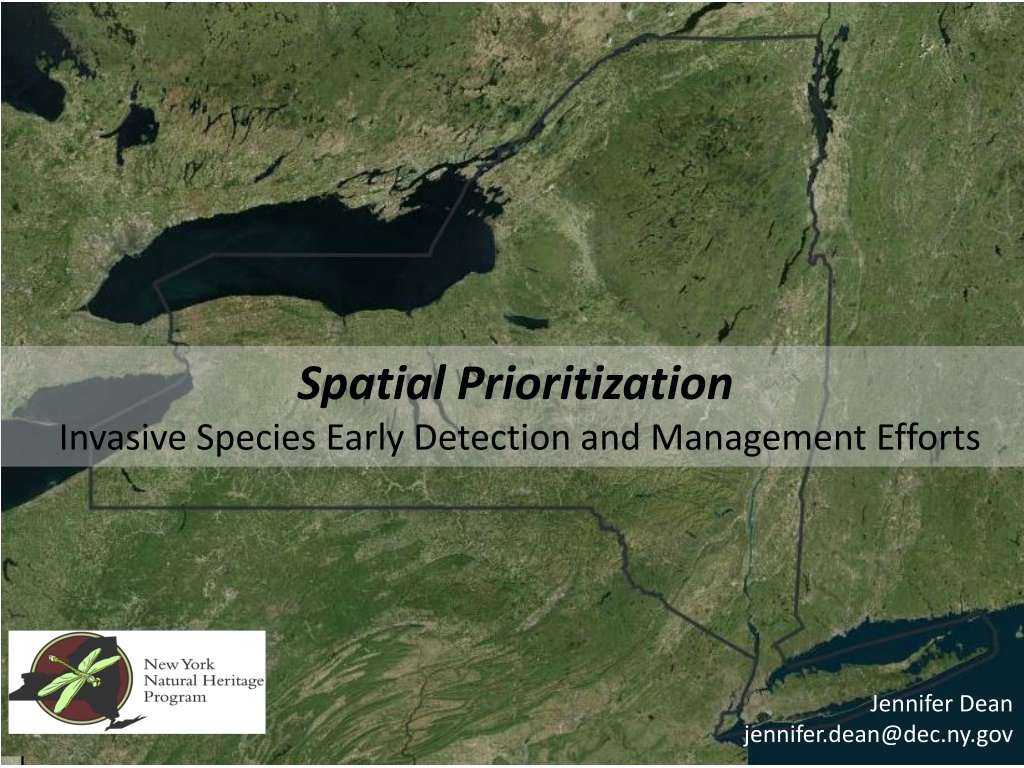
Jennifer Dean, in collaboration with NYS DEC and SUNY ESF, leads spatial prioritization efforts to focus on invasive species detection and management in protected areas, high conservation value zones, recreation destinations, and high-risk areas. Through innovative mapping resources and stakeholder feedback, the team aims to assist natural resource managers in prioritizing resources for early detection surveys and control strategies based on conservation value and risk of spread. Detailed components include ecological significance, protected or natural areas, and the risk of spread factors.

Download Presentation

Please find below an Image/Link to download the presentation.
The content on the website is provided AS IS for your information and personal use only. It may not be sold, licensed, or shared on other websites without obtaining consent from the author. Download presentation by click this link. If you encounter any issues during the download, it is possible that the publisher has removed the file from their server.
E N D
Presentation Transcript
Spatial Prioritization Invasive Species Early Detection and Management Efforts Jennifer Dean jennifer.dean@dec.ny.gov
Where to focus our invasive species efforts? Protected areas High conservation value Recreation destinations High risk areas Areas NOT heavily invaded
Our mission is to facilitate conservation of New York's biodiversity by providing comprehensive information and scientific expertise on rare species and natural ecosystems to resource managers and other conservation partners. Partnership between NYS DEC and SUNY ESF Invasive Species Database Program: Providing invasive species mapping resources for NYS
Spatial Prioritization Maps for Invasive Species Spatial Prioritization Maps for Invasive Species GOAL - Help Natural Resource Managers prioritize where to focus resources for Early Detection surveys and invasive species control by coupling conservation value and risk of spread. Basic Steps: 1) Compiled spatial data on factors influencing invasive control decisions Used layers with statewide coverage and fine scale resolution 2) Created new synthesis layers Driven by stakeholder feedback and expected uses Risk of Spread Conservation value Protection Status
Component Details: Ecological Significance Component Details: Ecological Significance Rare species locations, significant communities, and element distribution models Stream Biomonitoring Unit Biological Assessment Profile (stream quality metrics) Predicted native mussel richness Ryan Hagerty; USFWS
Component Details: Protected or Natural Component Details: Protected or Natural NYPAD New York Protected Areas Database Further lifted by NYNHP Biodiversity Index score National Land Cover Database Cover Type = Natural Cover
Component Details: Risk of Spread Component Details: Risk of Spread Landscape Condition Assessment (LCA) Transportation network Urban and Industrial Development Utility Corridors Land use-Land Cover created by NYNHP Recreation Use of Natural Areas Boat Launches Campgrounds Trailheads From NYS DEC data
Prioritization map component scores Prioritization map component scores ECOLOGICAL SIGNIFICANCE Layer Description Orig. Max New Max Weight Natural Heritage element occurrences, scored based on EO quality, accuracy, and rarity. Square root transformed the highly skewed data. Element Occurance Data 46 1 50 Mussels Number of predicted mussel species according to the Freshwater Blueprint. 17 1 5 Biological Assessment Profile- measure of stream health based on invertebrate diversity and abundance. BAP 9.45 1 5 Element Distribution Models Habitat predicted to be suitable for rare species according to Natural Heritage Element Distribution Models. 34 1 30 90 PROTECTED OR NATURAL/LIFTING FACTORS Layer Description Orig. Max New Max Weight All polygons in the New York Protected Areas Database were included. To provide a measure of relative habitat quality, each polygon was scored them by evaluating the average Natural Heritage Biodiversity Index score for each unique property name. NYPAD 10 1 15 Taken from the 2011 NLCD. Points given to land where "Cover Type" is equal to "Natural Cover . Natural Land 1 1 5 20 RISK OF SPREAD Layer Description Orig. Max New Max Weight Landscape Condition Assessment: depicts the presumed impacts from a suite of anthropogenic stressors. Created by NYNHP. LCA 3820 1 35 Data obtained from NYS GIS Clearinghouse DEC Trails, converted from KML to points. Calculated Euclidean distance to trails. Max distance 1000 meters. Trails 1000 1* 5 Data obtained from NYS GIS Clearinghouse, DEC Campgrounds converted from KML to polygons. Calculated Euclidean distance to campgrounds. Max distance 1000 meters. Campgrounds 1000 1* 5 Data obtained from Data Selector. Calculated Euclidean distance to boat launches. Max distance 1000 meters. Boat Launches 1000 1* 5 *Score was inverted (1/(1+distance) so that higher scoring pixels were those closest to the stressors, and the score diminishes with distance from 50
Comprehensive Score: Comprehensive Score: Ecological Significance + Protected or Natural + Risk Ecological Significance + Protected or Natural + Risk Ecological Significance Protected or Natural Risk of Spread 56% 13% 31% Comprehensive Score Areas of high conservation value with high risk of new invasions and dispersal
Using the prioritization map models Using the prioritization map models Working at different scales Working at different scales Example use Regional Scale Where can PRISM efforts target high value natural areas prone to new invasions and dispersal? Example use State Scale Where along major roads could DOT prioritize resources for invasive species control to maximize conservation values? Example use Local/Park Scale A big crew of volunteers is coming tomorrow! Which easily accessible areas would benefit from an invasive plant removal project?
Adding power to the models: Adding power to the models: Invasive Species Locations Invasive Species Locations
Comprehensive Score: Comprehensive Score: Ecological Significance + Protected or Natural + Risk Ecological Significance + Protected or Natural + Risk Ecological Significance Protected or Natural Risk of Spread 56% 13% 31% Comprehensive Score Areas of high conservation value with high risk of new invasions and dispersal
Use Use- -case examples case examples Where can I focus surveys/ treatments to protect the Where can I focus surveys/ treatments to protect the areas of highest conservation value areas of highest conservation value in my park in my park? ? Ecological Significance + iMap data
Use Use- -case examples case examples Where should I focus surveys in my preserve for Where should I focus surveys in my preserve for early detection species spread by humans? early detection species spread by humans? Risk of Spread + iMap data
Accessing the maps Within iMapInvasives As raster layers Need an iMap account Level 2 and up Request a login account: www.nyimapinvasives.org Map layers available to those with ArcGIS as tif files Email: imapinvasives@dec.ny.gov
Stakeholder Feedback Stakeholder Feedback Do the hot spots of the Comprehensive Score map correspond to areas you think should be highlighted in your region? Do the hot spots of the Ecological Significance map correspond to areas you think should be highlighted in your region? Examples of ways your organization/region would use these maps (or combinations of) to help make decisions.
Questions or feedback? Many Thanks!! NYNHP Team Amy Conley Tim Howard Brent Kinal Workgroup Carrie Brown-Lima NY ISRI Carri Marschner Cornell Hemlock Initiative Brendan Quirion - APIPP Linda Rohleder Lower Hudson PRISM Willow Eyres DEC ISCU Jerry Carlson DEC Lands and Forests Julie Lundgren OPRHP/NYNHP Contact info: Jennifer Dean jennifer.dean@dec.ny.gov imapinvasives@dec.ny.gov And many others providing feedback