Understanding Responsiveness in Measuring Outcomes for NBD Symptoms
Responsiveness is crucial in evaluating the effectiveness of treatments for NBD symptoms. It involves detecting change through repeated measurements, but there is a lack of consensus and standardized methods. Key concepts include Minimally Detectable Change (MDC) and Minimally Important Change (MIC), which reflect the smallest meaningful differences stakeholders consider significant. Various psychometric properties and methods like paired t-tests and Effect Size help determine responsiveness in measuring outcomes for NBD.

Download Presentation

Please find below an Image/Link to download the presentation.
The content on the website is provided AS IS for your information and personal use only. It may not be sold, licensed, or shared on other websites without obtaining consent from the author. Download presentation by click this link. If you encounter any issues during the download, it is possible that the publisher has removed the file from their server.
E N D
Presentation Transcript
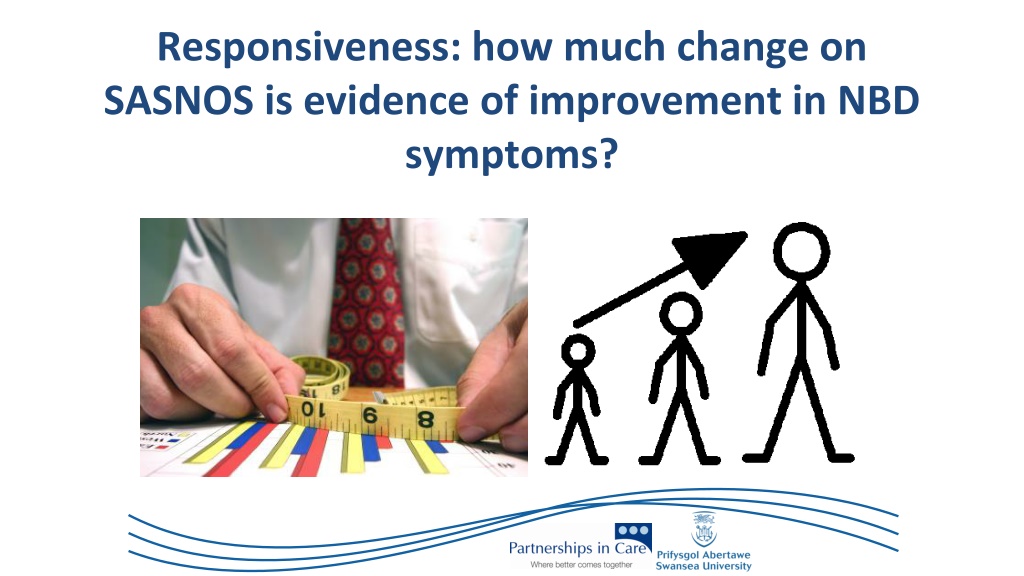
Responsiveness: how much change on SASNOS is evidence of improvement in NBD symptoms?
Measuring Outcomes Is my treatment the cause of this person s change? (Wilson, 1991) T1 T2 Repeated measurement can inform range of contexts at individual and group levels
Measuring Outcomes Holy Trinity of Psychometric Properties Validity Reliability Responsiveness The ability of an instrument to detect change Essential property to demonstrate for standardised measures used for repeated measurement, needs to work at both group and individual levels What is the minimum T1-T2 difference score that reflects change?
XXXX ? ?
Detecting Change on Psychometric Measures Despite its obvious functionality and requirement to demonstrate it in repeated measures context, information on responsiveness is often missing 10/27 (37%) instruments concerned in part/whole in measuring NBD had no responsiveness data; most that do use t-tests
Measuring Outcomes Lack of consensus re definitions of Responsiveness, no gold standard agreed on how determined Minimally Detectable Change (MDC): Smallest T1 T2 difference that falls outside the measurement error of an instrument Minimally Important Change (MIC): Smallest T1 T2 difference that corresponds to the smallest change in status that stakeholders (persons, patients, significant others, or clinicians) consider important.
Detecting Change on Psychometric Measures Minimally Important Change determined using an external anchor difficulties for NBD in ABI Distribution-based methods: Paired t-tests Effect Size (SRM) Standard Error of Measurement (SEM) MDC Confidence Intervals (90, 95%) 0.5 Standard Deviation Reviews have identified some distribution based methods coincide with change on anchors associated with MIC and can be used as proxies SEM cited in literature as both a method used to discriminate change beyond that expected from error, and as a MIC proxy
Detecting Change in NBD using SASNOS Alderman, Williams, Knight & Wood (submitted). Measuring change in symptoms of neurobehavioural disability: responsiveness of the St Andrew s Swansea Neurobehavioural Outcomes Scale (SASNOS). Determine whether SASNOS has the statistical properties to effectively measure expected change in symptoms of NBD over time Investigate what aspects of NBD are most amenable to NbR by determining magnitude of change in aggregate data in each SASNOS domain Identify cut-off scores for clinicians and researchers to employ across a range of contexts to reliably discriminate genuine improvement from those due to error in the instrument.
Responsiveness SASNOS Database Anonymous database of 542 participants in a range of UK residential NbR services At least 2x repeat SASNOS assessments for 145 Mean age at time of ABI 42.4 yrs, 71% male Mean time in NbR at T145.9 weeks T1-T2 < 12 months for 75% participants
SASNOS Responsiveness: measures of change T1-T2 Mean Difference Effect Size SRM SEM % improved Effect Size SRM (expected to improve) SEM % improved (expected to improve) t p Total 5.25 6.05 ** moderate 53.1 moderate 63.7 Interpersonal Behaviour 8.00 7.45 ** moderate 59.3 moderate 64.3 Cognition 8.32 8.81 ** large 64.8 large 68.2 Inhibition 2.61 3.13 * small 35.9 large 68.8 Aggression 1.27 1.37 ns small 32.4 large 77.8 Communication 2.67 3.72 ** small 43.4 large 66.7 ** p<.001, * p<.01
SASNOS Responsiveness: change in mean ratings T1 vs. T2 65 60 55 Mean T-score 50 45 40 35 30 25 20 T1 T2 T1 T2 T1 T2 T1 T2 T1 T2 T1 T2 Assessment ** p<.001, * p<.01
SASNOS Responsiveness: measures of change T1-T2 Mean Difference Effect Size SRM SEM % improved Effect Size SRM (expected to improve) SEM % improved (expected to improve) t p Total 5.25 6.05 ** moderate 53.1 moderate 63.7 Interpersonal Behaviour 8.00 7.45 ** moderate 59.3 moderate 64.3 Cognition 8.32 8.81 ** large 64.8 large 68.2 Inhibition 2.61 3.13 * small 35.9 large 68.8 Aggression 1.27 1.37 ns small 32.4 large 77.8 Communication 2.67 3.72 ** small 43.4 large 66.7 ** p<.001, * p<.01 <20 trivial ; 20 to <50 small ; 50 to <80 medium ; 80 large effect size T1-T2 difference > 1 SEM = meaningful change
Is change expected across all recipients of NbR?
SASNOS Responsiveness: change in mean ratings T1 vs. T2 65 60 55 50 Mean T-score 45 40 35 30 25 20 15 T1 T2 T1 T2 T1 T2 T1 T2 T1 T2 T1 T2 Assessment Not expected to change Expected to change ** p<.001, * p<.01
SASNOS Responsiveness: measures of change T1-T2 Mean Difference Effect Size SRM SEM % improved Effect Size SRM (expected to improve) SEM % improved (expected to improve) t p Total 5.25 6.05 ** moderate 53.1 moderate 63.7 Interpersonal Behaviour 8.00 7.45 ** moderate 59.3 moderate 64.3 Cognition 8.32 8.81 ** large 64.8 large 68.2 Inhibition 2.61 3.13 * small 35.9 large 68.8 Aggression 1.27 1.37 ns small 32.4 large 77.8 Communication 2.67 3.72 ** small 43.4 large 66.7 ** p<.001, * p<.01 <20 trivial ; 20 to <50 small ; 50 to <80 medium ; 80 large effect size T1-T2 difference > 1 SEM = meaningful change
SASNOS Responsiveness: service level performance indicators and benchmarking
Median change on SASNOS for PiC BIS NbR participants, 2016 SASNOS Effect Size SRM SEM % improved moderate Interpersonal Behaviour 55.9 Improvement indicators for SASNOS change scores, PiC BIS NbR participants in residence 2016 moderate Cognition 51.9 large Inhibition 62.5 large Aggression 75.0 large Communication 75.0 moderate Total Score 57.7
SASNOS Responsiveness: determining individual change Probabilities of the normal curve applied to SEM values 68% probability T1-T2 difference falls 1 SEM 96% probability T1-T2 difference falls 2 SEM If T1-T2 difference > 1 SEM = meaningful change If T1-T2 difference > 2 SEM = meaningful change & beyond error
SASNOS SEM T1-T2 Outcome Interpersonal Behaviour 3.77 19.3 > 2 SEM Cognition 2.67 15.5 > 2 SEM Inhibition 4.56 1.6 < 1 SEM Aggression 3.58 -3.3 < 1 SEM Communication 3.79 -6.2 < 2 SEM Total Score 2.88 8.7 > 2 SEM
In conclusion Study provides evidence SASNOS reliably measures change over time in NBD symptoms Extends the psychometric properties reported by Alderman, Wood and Williams (2011), confirming a role for use of the instrument by clinicians and researchers investigating the multidimensional outcomes arising from ABI Recommendations When question asked necessitates specifying an overall index of the magnitude of change, SRM is recommended. Is simple to calculate using repeated SASNOS assessments and the ES magnitude determined using Middel and van Sonderen s (2002) solution When the main goal is to determine individual change in scores, SEM thresholds recommended, associated with MDC and MIC
Tom Sustained a TBI as a result of a road traffic accident aged 30 Neuropsychological assessment revealed specific cognitive deficits in memory and executive functioning Disinhibition and aggression Various residential placements and inpatient admissions
On Admission Disinhibition Aggression Limited initiation of functional tasks Limited attendance and engagement in group sessions Low mood
Toms Neurobehavioural Rehabilitation Programme Timetable of group and individual therapeutic and leisure activities Behavioural programmes Psychoeducation Compensatory strategies Individual psychological therapy Family work Medication
Outcomes Reduction in disinhibition Reduction in aggression Some increase in insight Engagement Repeat neuropsychological assessment found memory and executive functioning deficits remained static
Pre and Post Neurobehavioural Rehabilitation TDT scores Pre Neurobehavioural Rehabilitation TDT scores Post Neurobehavioural Rehabilitation Support ratings Support ratings
Pre and Post Neurobehavioural Rehabilitation TDT scores Pre Neurobehavioural Rehabilitation TDT scores Post Neurobehavioural Rehabilitation Support ratings Support ratings
SASNOS SASNOS was sensitive to: Tom s progress in his rehabilitation programme areas that had remained static i.e. cognition areas where support and/or intervention was still being offered to further improve or maintain functioning
Whats Next: SASNOS-Revised No tool is perfect the first time .
NBD and Communication Current version has only 4 Communication items Feedback indicated current set of communication items was insufficient 30 new communication items
Validity and Reliability Recruit Larger Samples Neurologically Healthy: 300 (SASNOS-R) vs 100 (SASNOS) Stability of Neurobehavioural symptoms and behaviours in a normative sample 50 Participants over a two week period
Want To Be Involved? Take part in one of our current studies Help spread the word about our studies Follow us on twitter @SASNOS_ABI Email us: SASNOS@swansea.ac.uk Website in Development
Thanks for Listening