Reconciling Agricultural Growth with Poverty Reduction in Zambia
The presentation by Dr. Antony Chapoto at the Policy Dialogue on Food Security & Nutrition in Zambia highlighted the economic achievements, challenges, and opportunities for Zambia. Despite significant agricultural growth and GDP increase, persistent rural poverty remains a major concern, with 80% of rural population living in poverty. The country faces high malnutrition rates, rapid urbanization, and stagnant agricultural production. Zambia's under-exploited potential in agriculture, including fertile land and favorable climate, presents opportunities for smallholder farmers to contribute to the country's food security and economic growth.
Download Presentation

Please find below an Image/Link to download the presentation.
The content on the website is provided AS IS for your information and personal use only. It may not be sold, licensed, or shared on other websites without obtaining consent from the author. Download presentation by click this link. If you encounter any issues during the download, it is possible that the publisher has removed the file from their server.
E N D
Presentation Transcript
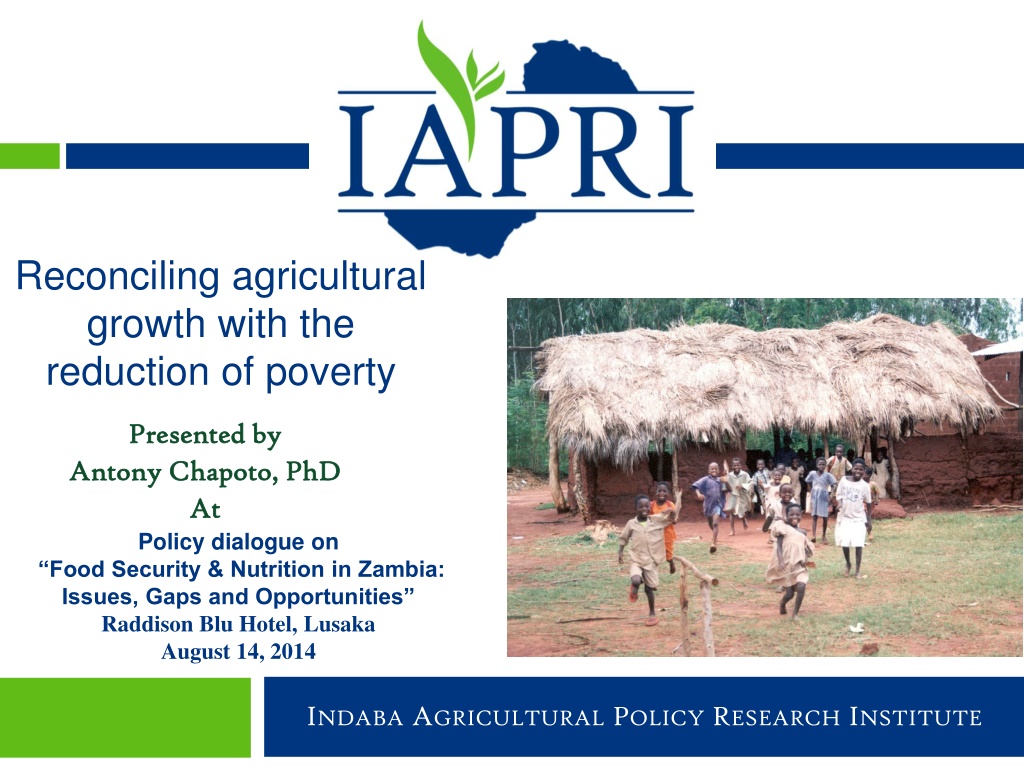
Reconciling agricultural growth with the reduction of poverty Presented by Presented by Antony Chapoto, PhD Antony Chapoto, PhD At At Policy dialogue on Food Security & Nutrition in Zambia: Issues, Gaps and Opportunities Raddison Blu Hotel, Lusaka August 14, 2014 INDABA AGRICULTURAL POLICY RESEARCH INSTITUTE Indaba Agricultural Policy Research Institute
Why this presentation 1 Highlight Zambia s economic achievements and potential Identify the opportunities arising from rising population (food demand) rapid urbanization rising urban incomes diverse and changing consumption patterns Data on Zambia s smallholder sector Potential value chains Conclusion Indaba Agricultural Policy Research Institute
Zambias Economic Achievements 2 Zambia Classified as low-middle income by World Bank GDP growing at 6% per annum Agricultural growth rate at 7% - above 6% CAADP Goal Three consecutive maize bumper harvest years BUT Persistently high rural poverty: 80% Indaba Agricultural Policy Research Institute
Behind this backdrop Zambia is characterized by Rapid population growth 13 million High poverty rates ~ 80% of rural people poor High food and income inequality in urban areas High malnutrition rates of children under 5 years Rapid urbanization and increasing demand for food Stagnant agricultural production Indaba Agricultural Policy Research Institute
Under exploited potential Zambia is in a unique position Abundance of fertile land Water Generally, favorable climate for agricultural production Growing population, rapid urbanization and rising incomes creating more opportunities for smallholder farmers Can easily become a Breadbasket for Southern Africa Indaba Agricultural Policy Research Institute
Rainfed Agriculture 5 Zambian smallholders highly vulnerable to weather shocks Ability to respond has improved Irrigation, winter maize Ag. policies stagnant % of maize area planted to be harvested Indaba Agricultural Policy Research Institute
Poverty in Zambia 90 80 70 Urban pop growing but rural population still high 64% Rural poverty rates stubbornly high Urban poverty declining rising income rising demand for a variety of ag processed commodities % Rural Poverty 60 50 40 30 20 10 0 1996 1998 2004 2006 2010 2012 Year Source: GRZ s Central Statistical Office and RALS 2012 Indaba Agricultural Policy Research Institute
Under nutrition a national problem 53% of under 5 children exhibit signs of growth stunting in Zambia Incidences of stunting are higher in rural Zambia than in urban: 56.6 % compared to 47.8% in urban. Eastern and Northern Provinces have the highest number of children who are stunted provinces with the highest high levels of poverty and relatively higher population densities Under 5 children exhibiting signs of growth stunting Source: LCMS 2006 Indaba Agricultural Policy Research Institute
Population growth and urbanization 8 Rising population and rapid urbanization Urban consumers income is growing but high inequality Changing consumption patterns Diverse market opportunities Are Zambia s agricultural policies amenable to these opportunities? Indaba Agricultural Policy Research Institute
Potential market: Urban Food Consumption Patterns Urban Food Budget Shares For Key Products, 2007 Combined importance of meat, eggs, fish & dairy has surpassed the role of cereals/staples. For poorest, cereals still dominate Vegetables also important group, especially for poorest Poultry & eggs have become very important & dominate the meats group outside Lusaka Food Item ----------% expenditure share ---------- Lusaka Kitwe Mansa Kasama Cereals & Staples 24.1 27.4 28.0 27.2 Dairy items 5.2 3.6 1.7 2.0 Meat & eggs 16.8 15.6 12.7 14.5 Fish 7.6 8.4 12.4 12.5 Vegetables 13.7 15.0 11.4 14.2 Fruits 3.6 4 3.7 4.0 Other Foods 16.4 17.1 16.9 18.4 Tobacco & alcohol 5.3 4.6 6.3 4.0 Food away from home 7.3 4.3 6.9 3.2 Total 100.0 100.0 100.0 100.0 Indaba Agricultural Policy Research Institute
Potential market: Urban Food Consumption Patterns Share of different staples within total expenditure on staples by urban centre maize still dominates for lower income consumers, but wheat has become very important for all urban consumers. In Lusaka, wheat products dominate among staples except for the lowest expenditure groups Cassava important in Mansa & Kasama, esp. among low expenditure quintile of consumers ---% Percent share by urban centre--- Lusaka Kitwe Mansa Kasama Staple Maize 39.8 45.3 43.6 45.4 Wheat 40.7 36.1 17.9 17.6 Rice 8.7 8.8 8.2 12.1 Cassava 0.8 1.8 20.4 13.6 Other staples 10.0 8.0 10.0 11.4 Total 100.0 100.0 100.0 100.0 Indaba Agricultural Policy Research Institute
Wheat Product Consumption Trends - Zambia 11 Indaba Agricultural Policy Research Institute
Urban Food Budget Shares Staples 12 --------------------------% Expenditure Share ----------------------- Food Items Lusaka Kitwe Mansa Kasama low med high low med high low med high low med high 28.4 24.2 18.7 31.8 26.6 22 32.1 27.2 23 32.3 26.2 23.2 Staples Maize 14.6 8.5 4.6 17.5 11.3 6.2 14.9 12.4 8.3 16.0 12.3 8.8 Rice 1.9 2.4 2.1 2.3 2.6 2.5 1.9 2.6 2.4 3.5 3.3 2.9 Wheat 9.2 10.7 9.6 9.1 10.0 10.8 2.0 5.6 8.4 1.7 4.7 7.9 Cassava .2 .2 .2 .6 .6 .3 9.9 4.0 1.9 7.4 2.8 1.1 Other staples 2.5 2.4 2.2 2.3 2.1 2.2 3.4 2.6 2.0 3.7 3.1 2.5 Meat and Eggs 14.1 18.0 18.6 11.9 17.0 19.2 7.9 15.0 16.5 10.2 14.7 18.6 Vegetables 17.6 12.9 9.8 18.6 14.4 10.5 13.1 11.2 9.5 17.2 14.1 11.4 All other expenditure 39.9 44.9 52.9 37.7 42.0 48.3 46.9 46.6 51.0 40.3 45.0 46.8 100 100 100 100 100 100 100 100 100 100 100 100 Total Indaba Agricultural Policy Research Institute
Urban Food Budget Shares-Meat & Eggs 13 --------------------------------% Expenditure Share ----------------------------------- Food Items Lusaka Kitwe Mansa low med high low med high low med high Meat & eggs 14.0 18.0 18.6 11.8 16.8 19.1 7.9 14.9 16.5 Read Meat 5.2 7.4 8.1 3.7 5.6 7.2 1.5 4.4 6.0 Pork 1.4 1.3 0.9 0.3 0.6 0.9 1.0 1.1 0.5 Chicken/poultry 5.7 6.6 7.4 5.9 8.2 9.7 4.6 7.2 7.1 Eggs 1.7 2.7 2.2 1.8 2.4 2.3 0.8 2.4 2.9 Dairy items 3.4 5.8 6.7 2.0 3.7 5.7 0.6 1.8 3.5 28.4 24.2 18.7 31.8 26.6 22.0 32.1 27.2 23.0 Staples Vegetables 17.6 12.9 9.8 18.6 14.4 10.5 13.1 11.2 9.5 36.6 39.1 46.2 35.8 38.5 42.7 46.3 44.9 47.5 All other expenditure Total 100 100 100 Indaba Agricultural Policy Research Institute 100 100 100 100 100 100
Principal Crop Zones Maize-led economy Surplus Maize Central and South Surplus Cassava North Indaba Agricultural Policy Research Institute
Livelihood Zones Zambia has potential for diversity For most recent livelihood zone report see http://www.fews.net/sites/default/files/documents/reports/ZM_LZ_descriptions_2014.pdf Indaba Agricultural Policy Research Institute
Smallholder farmers land constrained 16 Evidence that many smallholder households are land constrained -- 25% have less than 0.5 ha of land -- 58% indicate there is no unallocated land in their village http://www.koinoniazambia.org/koinoniazambia/images/5503_a13229.jpg Indaba Agricultural Policy Research Institute
Percent of smallholder that say There is NO land available <20% 20-40% 41-60% 61-80% >81% Indaba Agricultural Policy Research Institute
Land Utilization Follows Infrastructure Development 18 Population Density and Distribution in Zambia, 2007 Settlements concentrated on areas with infrastructure Hence the paradox of land constraints in midst of plenty Source: FSRP (2009). Agricultural Surveys Voice of smallholder farmers Considerable land is covered by water, national parks, GMA Indaba Agricultural Policy Research Institute
Land constraints Rural settlement follows public investment in rural infrastructure Land constraints in a land-abundant country is not a paradox economically viable arable land requires access to basic services, water, schools, roads, and markets. The basic public investments to make settlement economically viable have yet been made in many areas of Zambia Indaba Agricultural Policy Research Institute
Food crops production trends 20 Maize and Cassava production 3,000 Thousands 2,500 2,000 Metric Tonnes 1,500 1,000 500 0 2002/03 2003/04 2004/05 2005/06 2006/07 Maize 2007/08 Cassava 2008/09 2009/10 2010/11 2011/12 Source: CFS, various years Indaba Agricultural Policy Research Institute
Food crops production trends 21 Groundnuts, Sweet potato and Beans production 300,000 250,000 200,000 Metric Tonnes 150,000 100,000 50,000 0 2002/03 2003/04 2004/05 2005/06 2006/07 2007/08 2008/09 2009/10 2010/11 2011/12 Groundnuts Sweet Potato Beans Indaba Agricultural Policy Research Institute Source: CFS, various years
Negatively affecting Crop Diversification 22 Area cultivated 1,400 Thousands 1,200 1,000 800 Hectares Maize Cassava 600 Groundnuts 400 200 0 2002/03 2003/04 2004/05 2005/06 2006/07 2007/08 2008/09 2009/10 2010/11 2011/12 Indaba Agricultural Policy Research Institute Source: CFS, various years
Average yields of key commodities compared to global average 23 Source: CFS datasets, various years with Global figures obtained from COMESA Indaba Agricultural Policy Research Institute
Livestock Ownership among Smallholder farmers 24 Of 1,417,992 smallholder farmers 21.2% own cattle 25.3% own goats 14.7% own pigs 0.6% own sheep 76% own village chicken Source: RALS (2012): Note HH=household Indaba Agricultural Policy Research Institute
Average Number of livestock Owned among Smallholder Livestock Households 25 National average of livestock owned among smallholder households Source: RALS (2012) Indaba Agricultural Policy Research Institute
Cassava Indaba Agricultural Policy Research Institute
Zambia Cassava Production most important crop grown after maize produced by small-scale farmers Current production >1million tons/year >80% of households in the cassava belt rely on cassava as a staple especially the poorest Great potential Two initiatives started to enhance cassava production and utilization Root and Tuber Improvement Programme Acceleration of Cassava Utilization Task Force Cassava Strategy Plan for the sector Indaba Agricultural Policy Research Institute
Zambia Cassava Production Indaba Agricultural Policy Research Institute
Horticulture: An option for smallscale producers? Urban Food Budget Shares For Key Products, 2007 Cheap effective source of vitamins, minerals & calories. Positive impact on other agro production systems (re investment potential). Food Item ----------% expenditure share ---------- Lusaka Kitw e Mansa Kasam a Cereals & Staples 24.1 27.4 28.0 27.2 Dairy items 5.2 3.6 1.7 2.0 Meat & eggs 16.8 15.6 12.7 14.5 Potential avenue for poverty reduction through ag for land-constrained farmers BUT, land constrained farmers tend to be poor in income and assets (including education) And hort. production requires high use of inputs such as cash inputs and knowledge Fish 7.6 8.4 12.4 12.5 Vegetables 13.7 15.0 11.4 14.2 Fruits 3.6 4 3.7 4.0 Other Foods 16.4 17.1 16.9 18.4 Tobacco & alcohol 5.3 4.6 6.3 4.0 Food away from home 7.3 4.3 6.9 3.2 Total 100.0 100. 0 100.0 100.0 Indaba Agricultural Policy Research Institute
Horticulture not yet playing a major role for most land-constrained farmers Share of hhs selling ffv and maize, by quintile of land holding 0.5 0.45 0.4 0.35 Share selling Maize 0.3 0.25 FFV 0.2 0.15 0.1 0.05 0 1 2 3 4 5 Quintile of land holding Indaba Agricultural Policy Research Institute
Playing a much larger role in Kenya Share selling ffv and maize, by quintile of land holding KENYA FFV 0.9 0.8 0.7 Maize 0.6 Share selling 0.5 0.4 0.3 0.2 0.1 0 1 2 3 4 5 Quintile of land holding Indaba Agricultural Policy Research Institute
Conclusion 32 Zambia has: potential to have broad-based economic growth; potential to address the stubbornly high rural poverty rates and high malnutrition; potential to be the breadbasket for the region ; But: Policies should evolve and take advantage of the many agricultural opportunities arising from the rising food demand, rising urban incomes and the changing consumption patterns. Indaba Agricultural Policy Research Institute
Thank You Thank You 33 Indaba Agricultural Policy Research Institute
