Challenges and Evolution of Social Services in South Africa
The history of social services in South Africa dates back to the early 20th century, with a gradual shift towards state involvement and privatization in later years. However, funding challenges, low salaries for welfare workers, and increasing reliance on the Department of Social Development and NGOs have posed significant obstacles. The current situation reflects a global recession's impact, donor withdrawal, and a need for increased government funding to support essential services.

Download Presentation

Please find below an Image/Link to download the presentation.
The content on the website is provided AS IS for your information and personal use only. It may not be sold, licensed, or shared on other websites without obtaining consent from the author. Download presentation by click this link. If you encounter any issues during the download, it is possible that the publisher has removed the file from their server.
E N D
Presentation Transcript
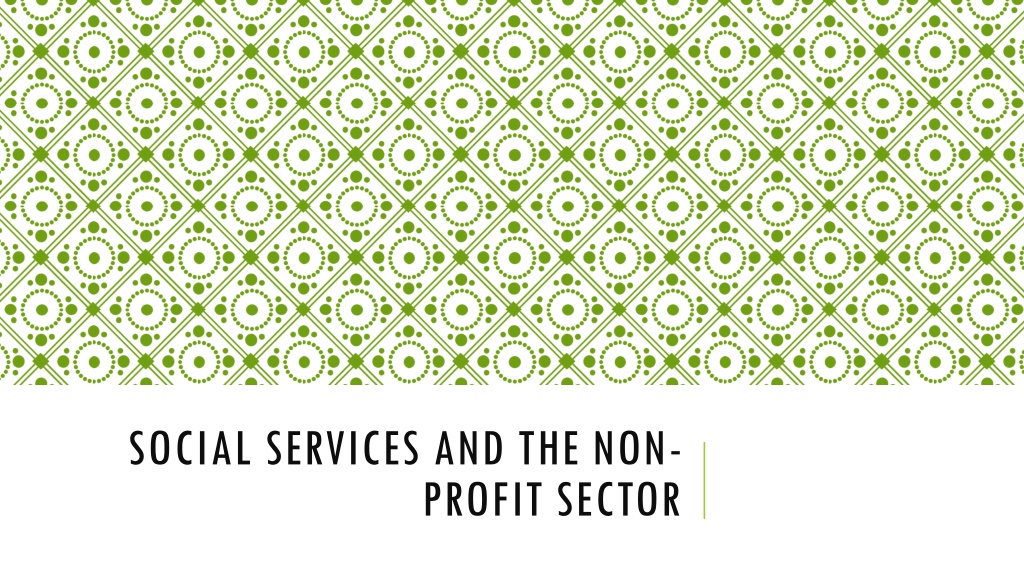
SOCIAL SERVICES AND THE NON- PROFIT SECTOR
A SHORT HISTORY 1910 Union of SA - church and voluntary welfare initiatives began co-ordinating efforts foundation of later relationship with the state. 1929 Carnegie Commission into poor white problem 1937 first state welfare department rehabilitation of socially maladjusted individual or family, study of social maladjustment and co-ordination of services. 1948 National Party comes to power and policies and programmes introduced modelled on post-war programmes adopted in Europe and North America. Active racial differentiation of services. State-church-welfare organisations proliferated. African self-help organisations created, as well as by coloured and Indian communities. 1980s privatisation introduced. SA not a welfare state partnerships between state, private business sector and voluntary religious and community initiatives. Needs met through community and individual responsibility, market mechanisms, voluntarism, fees and privatisation. Selective and residual policies introduced
FUNDING SERVICES GENERALLY - DSD Like farm workers and domestic workers, employees of welfare organisations receiving funding from government excluded from protection of labour legislation until 1997. Welfare workers are covered by a ministerial determination which varies (downwards?) protection iro overtime, averaging of hours, work on Sundays, night allowance, and standby. Social welfare programmes were not considered to be critical social investment priorities and were under-resourced (Department of Welfare 1997: 7). Consequently salaries are extremely low, and working conditions and service conditions are poor for all welfare personnel Stratified, two-tier system of employment has since emerged. NAWONGO matter in the Free State: government facilities must of necessity employ sufficient numbers of laundry and cleaning staff, children s homes run by NPOs utilise the services of the spouse it employs to render these services, who may have one person assisting her; government facilities must of necessity either employ sufficient numbers of catering staff or outsource its catering services to private companies, children s homes run by NPO s utilise the services of the spouse it employs to render these services, who may enlist the assistance of the older children in the house for this purpose; (DSD replying affidavit)
CURRENT SITUATION Global recession of 2008 Movement of donors away from SA a middle income country, state should fund services = increasing dependence on DSD NPOs providing bulk of services, 2012/13 74% of provincial DSD VEP budgets transferred to NGOs, dropping to 68% in 2013/14 DSD subsidising anything from 30% to 70% of costs. NPOs expected to find the balance. Significant variations in what funded and amount both intra- and inter-provincially. Staff categorised as volunteers Below farm worker minimum Late payments nine months
Different skills and determinations Limited support from the corporate sector Expenditure on CSI in 2014 amounted to R6 billion. Taking inflation into account this represented a 2% decline in expenditure compared to 2013. Support to the social and community development sector declined from 83% in 2013, to 77% in 2014. In 2014, 16% of CSI expenditure went towards the social and community development sector. The greatest proportion of this budget went to orphans and vulnerable children (33%) and people living with HIV or AIDS (12%). Six percent (6%) of the social and community development sector budget was allocated towards victims of violence and abuse. Because we do not know how much of this reached services providing post-rape care, or shelters and other domestic violence services, we cannot score the corporate sector
Subsidies cut without explanation No increases State and NPO distinction 1year funding no benefits Poor relationship Per capita, programme and post costs
THE EXPANDED PUBLIC WORKS PROGRAMME Short-term, labour-intensive work paid below market rate in the areas of infrastructure, environment and culture, and the social sector. Non-state sector programme, comprising community works programme and non-profit organisations (NPO) added in 2009. In 2006/07 social sector participants the lowest-paid (average minimum rate of R593/month) and infrastructure best-paid (average minimum rate of R1 154/month) Fourth quarter of 2007/08, at an average of R32.70 per day, social sector wages still the lowest while infrastructure, at R62.54 per day, remained the highest. In the second quarter of 2008/09 the average daily amounts had increased to R36.29 and R67.04 per day respectively.
EPWP APRIL SEPTEMBER 2012 Sector Women Avg daily wage Infrastructure 51% R101.79 Environment and culture 53% R82.23 Social sector 85% R40.19 Community works 72% R58.90 Non-profit organisations 75% R43.48 Average/totals 62% R62.00
1 APRIL 30 JUNE 2014 Sector Women Avg daily wage Infrastructure 61% R 128.17 Environment and culture 57% R 106.16 Social sector 86% R 75.32 Community works 78% R 72.36 Non-profit organizations 77% R 71.00 Average/totals 68% R99.00