Study on Coatings Composition and Performance
The study investigated the targeted and measured concentrations of Ti and Zr in magnetron-sputtered coatings, their impact on conversion layer thickness, and the relative atomic concentrations in hydrothermal conversion layers on Al-12Zr and Al-12Ti. Open circuit potential values before and after hydrothermal treatment were also examined. The findings provide valuable insights into the composition-performance relationship of these coatings.

Uploaded on Sep 20, 2024 | 0 Views
Download Presentation

Please find below an Image/Link to download the presentation.
The content on the website is provided AS IS for your information and personal use only. It may not be sold, licensed, or shared on other websites without obtaining consent from the author. Download presentation by click this link. If you encounter any issues during the download, it is possible that the publisher has removed the file from their server.
E N D
Presentation Transcript
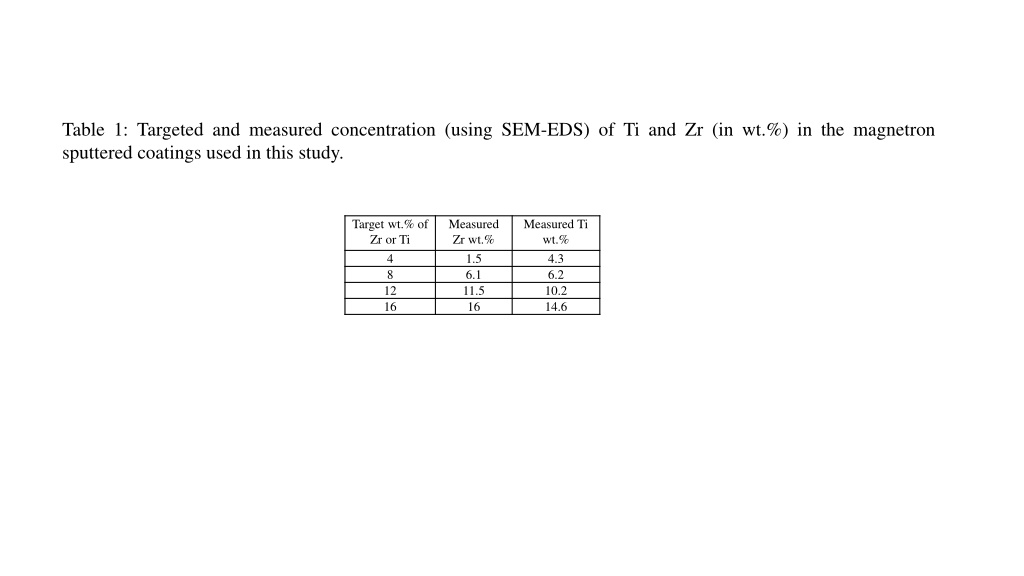
Table 1: Targeted and measured concentration (using SEM-EDS) of Ti and Zr (in wt.%) in the magnetron sputtered coatings used in this study. Target wt.% of Zr or Ti 4 8 12 16 Measured Zr wt.% 1.5 6.1 11.5 16 Measured Ti wt.% 4.3 6.2 10.2 14.6
Table 2: Hydrothermally generated conversion layer thickness on pure Al and sputter deposited Al-Zr and Al-Ti coatings as a function of Zr, or Ti concentration measured using RF-GDOES sputtering. Zr Ti Sample name Conversion layer thickness Standard deviation Sample name Conversion layer thickness Standard deviation concentratio n wt.% 0 1.5 6.1 11.5 16 concentratio n wt.% 0 4.3 6.2 10.2 14.6 nm 1303 948 609 513 554 nm 167 41 5 7 6 nm 1303 747 715 569 356 nm 167 40 81 26 32 AA1090 Al-4Zr Al-8Zr Al-12Zr Al-16Zr AA1090 Al-4Ti Al-8Ti Al-12Ti Al-16Ti
Table 3: Relative atomic concentration of different elements in the three regions of the hydrothermal conversion layers on Al-12Zr, and Al-12Ti measured using TEM-EDS. Standard deviation Standard deviation Standard deviation Standard deviation Region Zr/Al O/(Al+Zr) Ti/Al O/(Al+Ti) Sputtered Coating Compact Oxide Needle Oxide 0.02 - 0.02 - 0.05 - 0.04 - 0.06 0 0.01 - 2.15 1.67 0.22 0.15 0.15 0.00 0.02 - 1.70 1.78 0.08 0.08
Table 4: Open circuit potential values for the pure Al, magnetron sputtered Al-Zr and Al-Ti coatings before and after hydrothermal treatment measured in a 0.1 M NaCl solution against an Ag/AgCl reference electrode. Hydrothermally treated Hydrothermally treated As received As received Concentration Concentration Sample name Sample name Standard deviation Standard deviation Standard deviation Standard deviation OCP OCP OCP OCP wt.% 0.00 1.5 6.1 11.5 16 mV vs Ag/AgCl 73.71 57.73 84.33 55.12 54.13 wt.% 0.00 4.3 6.2 10.2 14.6 mV vs Ag/AgCl 73.71 89.93 92.83 10.79 27.98 AA1090 Al-4Zr Al-8Zr Al-12Zr Al-16Zr AA1090 Al-4Ti Al-8Ti Al-12Ti Al-16Ti -645.20 -725.76 -738.19 -648.54 -640.98 -1289.65 -1271.60 -756.78 -805.17 -784.96 54.66 97.53 92.14 138.61 126.95 -645.20 -726.90 -721.54 -748.92 -655.27 -1289.65 -593.34 -650.23 -563.08 -481.79 54.66 34.06 30.67 43.82 31.36
")