Vitamin B6 Levels in Cats: Correlation with Age and Body Condition Score
Explore the potential correlation between Vitamin B6 levels, age, and body condition score in cats through a study involving blood collection, sample preparation, and measuring AST activity. Understanding Vitamin B6 status is essential for addressing deficiencies and potential nutritional interventions in feline populations.
Download Presentation

Please find below an Image/Link to download the presentation.
The content on the website is provided AS IS for your information and personal use only. It may not be sold, licensed, or shared on other websites without obtaining consent from the author. Download presentation by click this link. If you encounter any issues during the download, it is possible that the publisher has removed the file from their server.
E N D
Presentation Transcript
Vitamin B6 Vitamin B6 in Cats in Cats Vy Chu
Hypothesis Vitamin B6 levels are negatively correlated with age and body condition score in cats
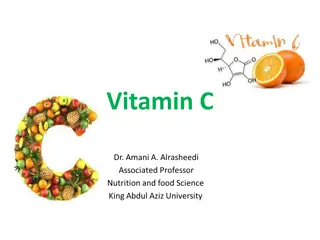
What is vitamin B6? Essential vitamin Wide variety of function including protein metabolism, immune function, gluconeogenesis, and more
Why does it matter? Prevalence of vitamin B6 deficiencies in elderly human population Lack of data on vitamin levels in cats despite increasing life expectancy If and when nutritional interventions may be necessary
Methods 01 Blood collection . 60 cats from cat colony Age 1-17 years old Body condition score 4-8 44 females and 16 males All consuming same diet for all life stages
Methods 02 Sample preparation Centrifugated Plasma removed Packed red blood cells washed in phosphate buffer saline Suspended in triton-X solution to lyse cells Diluted with phosphate buffer to measure enzymatic activity
Measuring AST activity as a functional biomarker for vitamin B6 Vitamin B6 is a cofactor for aspartate aminotransferase (AST) AST L-aspartate + alpha-ketoglutarate Oxaloacetate + L-glutamate MDH Oxaloacetate + H++ NADH Malate + NAD+
AST L-aspartate + alpha-ketoglutarate Oxaloacetate + L-glutamate MDH Oxaloacetate + H++ NADH Malate + NAD+
Measure decrease in NADH NADH vs time 12 10 8 NADH 6 4 2 0 0 2 4 6 8 10 12 Time Slope is enzymatic activity of AST
Primary activation ratio (PAR) Activity of AST with added vitamin B6 divided by activity of AST without added vitamin B6 1 sample has 2 measurements: one without additional B6 and one with B6 Good indicator of vitamin B6 status Higher PAR reflects lower vitamin B6 status
Blank Blank With B6 No B6 No B6 With B6 y = -0.0002x + 0.5076 y = -0.0009x + 0.7126 y = -0.0093x + 0.5857 y = -0.0061x + 0.7573 0.9 0.7 0.8 0.6 0.7 0.5 0.6 0.4 0.5 0.3 0.4 0.3 0.2 0.2 0.1 0.1 0 0 0 5 10 15 20 25 0 5 10 15 20 25 Blank With B6 Blank No B6 Blank has same reagents except alpha-ketoglutarate
BCA Protein Assay Quantification of total protein in samples Enzyme activity will be expressed in units per mg of protein Protein concentration causes color change which is measured and compared to protein solutions of known concentration Standard curve 700 600 Protein concentration (ug/ml) 500 y = 921.19x - 10.222 400 300 200 100 0 0 0.1 0.2 0.3 0.4 0.5 0.6 0.7 -100 Absorbance
Calculations Beer-Lambert Law Solve for concentration Divide by protein concentration Calculate PAR A = aborbance = molar absorptivity B= length of light path C = concentration
Statistics Used JMP for linear regression Y-variable as activity with no B6, activity with B6, and PAR X-variable as age, sex, BCS Only activity with no B6 and PAR was statistically significant Equation for age: PAR = 4.63 + 0.789xage
Whats next? Normal Distributed? JMP analyzed distribution of PAR values to see if it is normally distributed Shapiro-Wilk test: how close does the data fit to normal distribution?
Whats next? Blood samples from VMTH cases Enzymatic activity and PAR values already calculated for 57 samples Convert data to normal distribution to identify cut off values for deficiency Use to find if any VMTH cases are deficient and if so, does the patient have any symptoms associated with vitamin B6 deficiency?
References LimpertE, StahelWA. Problems with using the normal distribution and ways to improve quality and efficiency of data analysis. PLoS ONE. 2011;6(7). doi:10.1371/journal.pone.0021403 Marriott BP, Birt DF, Stalling VA, Yates AA. Present Knowledge in Nutrition. London: Academic Press; 2020. Sechi GP, SechiE, Fois C, Kumar N. Advances in clinical determinants and neurological manifestations of B vitamin deficiency in adults. Nutrition Reviews. 2016;74(5):281-300. doi:10.1093/nutrit/nuv107 SpinnekerA, Sola R, LemmenV, Castillo MJ, PietrzikK, Gonz lez-Gross M. Vitamin B6 status, deficiency and its consequences--an overview. NutrHosp. 2007;22(1):7-24. UelandPM, UlvikA, Rios-Avila L, Midttun , Gregory JF. Direct and functional biomarkers of vitamin B6 status. Annual Review of Nutrition. 2015;35(1):33-70. doi:10.1146/annurev-nutr-071714-034330


