Understanding Network Metrics and Density Analysis
Explore different types of network metrics such as density, centrality, and visualization techniques. Learn how to prepare data for graph-based analysis and understand the concept of network density. Gain insights into measuring network density and centralization in social networks.

Download Presentation

Please find below an Image/Link to download the presentation.
The content on the website is provided AS IS for your information and personal use only. It may not be sold, licensed, or shared on other websites without obtaining consent from the author. Download presentation by click this link. If you encounter any issues during the download, it is possible that the publisher has removed the file from their server.
E N D
Presentation Transcript
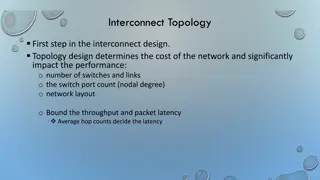
Types of network metrics Group level Density Components Isolates Cliques Centralization Degree Closeness Betweenness Factions Core-periphery Node level Centrality Degree Indegree Outdegree Closeness Betweenness Visualization Netdraw Mage QAP Statistical metrics MDS Cluster analysis
Preparing the data Most graph-based metrics require symmetric, dichotomous (binary) data Symmetrization Minimum (captures reciprocal ties) Maximum (most inclusive) Dichotomize Valued data are typically ordinal Mean, median or modal values
Network Density The proportion of ties that exist out of all possible ties For valued data the sum of all tie strengths divided by all possible ties
Density is a course measure Density = .33 Degree centralization = 10% Density = .33 Degree centralization = 60%
Centrality versus centralization Centrality is a node level metric; each node has a centrality score representing it s position within the network Centralization is a group level metric indicating the extent to which the network is dominated by one or a few nodes