Insights into Wine and Alcohol Consumption Trends Among Different Generations
This data analysis explores perceptions, awareness, and current customer behaviors related to major wine brands among different generations, including Gen Z, Millennials, Gen X, and Baby Boomers. The study also delves into alcohol consumption and purchasing behavior, preferences, and changes in drinking habits across various age groups. Additionally, it provides information on cannabis consumption trends among different generations.
- Wine consumption trends
- Alcohol purchasing behavior
- Generational preferences
- Cannabis consumption
- Data analysis

Download Presentation

Please find below an Image/Link to download the presentation.
The content on the website is provided AS IS for your information and personal use only. It may not be sold, licensed, or shared on other websites without obtaining consent from the author. Download presentation by click this link. If you encounter any issues during the download, it is possible that the publisher has removed the file from their server.
E N D
Presentation Transcript
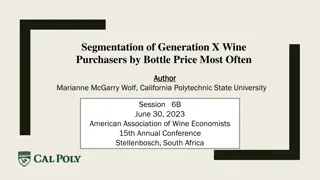
Millennial & Gen Z Perceptions of the Wine Industry YouGov Profiles Data Questions? Please email katherine.garrity@yougov.com
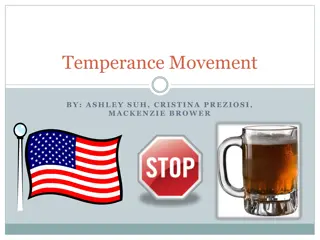
Awareness is highest for Barefoot Wine among GenPop and every generation aside from Boomers, where Awareness trended the highest for Sutter Home. Gen Z trends below other age groups for Awareness on all major wine brands presented in this analysis. Aided Awareness: Wine Brands Which of the following brands have you ever heard of? 68 49 67 Barefoot 74 66 67 19 49 Sutter Home 73 79 65 34 58 Yellow Tail 67 70 55 42 57 Stella Rosa 59 51 37 11 Robert Mondavi Winery 20 35 51 0 10 20 30 Gen Z 40 50 60 70 80 GenPop Millennial Gen X Boomer Indicates highest Awareness in age group Source: YouGov Profiles, 2023-10-22 Dataset Time Range: Last 52 weeks
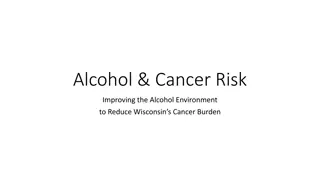
Barefoot, which has the highest Awareness among most age groups, also has the highest percentage current customer among GenPop, Gen X, and Boomers. However, Gen Z and Millennials are purchasing Stella Rosa at a higher rate than other major wine brands surveyed. Current Customer: Wine Brands Have you purchased wine from any of the following brands in the past 30 days? 8 6 10 Barefoot 10 6 7 7 12 Stella Rosa 8 3 5 4 6 Yellow Tail 6 4 5 4 5 Sutter Home 5 5 3 3 4 Cupcake Vineyards 3 2 -1 1 3 5 7 9 11 13 15 GenPop Gen Z Millennial Gen X Boomer Indicates highest percentage Current Customer in age group Source: YouGov Profiles, 2023-10-22 Dataset Time Range: Last 52 weeks
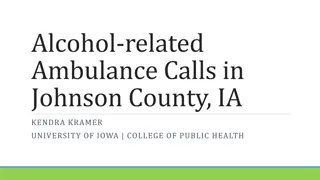
Quick Facts: Alcohol consumption and purchasing behavior 38% of Gen Z , 62% of Millennial, 62% of Gen X and 57% of Boomers consume alcohol Favorite Alcoholic Beverage Frequency of purchasing alcohol 21 40 39 19 18 33 33 15 14 26 24 24 24 23 23 23 22 11 11 19 18 18 10 15 14 8 11 11 9 9 9 8 6 6 5 4 4 4 4 3 3 3 3 3 3 3 2 2 1 1 More than once per week Once a week At least once per month Less often than once per month Never Beer Wine Vodka Bourbon Prepared cocktails GenPop Gen Z Millennial Gen X Boomer I like spirits more than beer or wine (% agree) Consumption compared to last year GenPop Gen Z Millen. Gen X Boomer 31 30 27 26 25 24 37 40 46 36 26 22 21 20 19 19 19 14 12 12 12 9 It s worth paying extra for good quality beer or wine (% agree) 7 6 3 GenPop Gen Z Millen. Gen X Boomer I have increased my alcohol consumption in the last year Source: YouGov Profiles, 2023-10-22 Dataset Time Range: Last 52 weeks I drink the same amount of alcohol compared to last year I have cut down on my alcohol consumption in the past year I have given up drinking alcohol completely 53 51 62 53 45
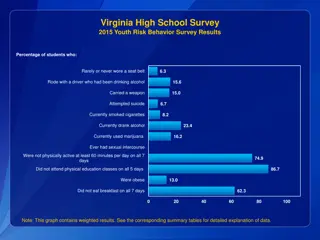
Quick Facts: Cannabis consumption and purchasing behavior 15% of Gen Z , 20% of Millennial, 19% of Gen X and 14% of Boomers consume cannabis / marijuana products Top cannabis products used Frequency use cannabis / marijuana products 15 13 20 19 12 12 12 12 16 10 10 10 10 15 14 9 12 8 11 7 7 7 7 9 8 6 6 7 5 5 5 5 5 4 4 4 4 3 2 2 2 2 2 2 2 1 1 1 2 2 At least one per day At least once per week At least once per month Less often than once per month Total use cannabis Smoking Edibles Vaping / dabbing Ingestibles Topical body products GenPop Gen Z Millennial Gen X Boomer Support for Legalization of Marijuana Top reasons for cannabis use 14 69 13 63 60 56 11 54 10 10 10 10 10 9 8 8 7 7 7 7 7 6 6 6 6 30 28 26 5 5 21 4 16 3 13 13 13 13 11 2 Improve sleep quality Helps to relax Treat pain / discomfort Personal enjoyment Treat depression / Support Neutral Oppose anxiety Source: YouGov Profiles, 2023-10-22 Dataset Time Range: Last 52 weeks
Quick Facts: Importance of sustainability in purchasing behavior Frequency buy products that use ethical materials Product labels taken into consideration 37 38 31 36 36 30 35 28 33 26 26 26 26 31 25 30 24 23 22 22 21 21 21 27 20 20 20 19 18 18 24 16 15 21 12 17 16 15 14 13 13 12 11 10 8 Low sugar/ No added sugar Organic Environmentally Friendly Non-GMO Local Product Regularly/Often Sometimes Rarely Never GenPop Gen Z Millennial Gen X Boomer I think brands should consider environmental sustainability when putting on events (% agree) Psychographic Statements Environment & Sustainability GenPop Gen Z Millen. Gen X Boomer I try to buy only from companies who are socially and environmentally responsible (% agree) 64 76 74 61 57 GenPop Gen Z Millen. Gen X Boomer I like when companies have a moral message (% agree) 42 56 53 37 33 GenPop Gen Z Millen. Gen X Boomer 59 67 65 55 52 Source: YouGov Profiles, 2023-10-22 Dataset Time Range: Last 52 weeks