Understanding Petroleum Metabolite Toxicity in Environmental Case Studies

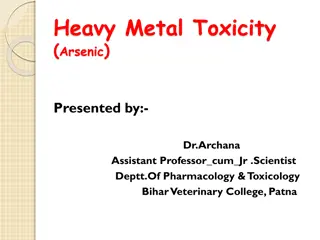
“Metabolite” Tapwater Toxicity in ITRC Case Studies
Roger Brewer, Hawaii Dept of Health
ITRC TPH Risk Team, September 19, 2017
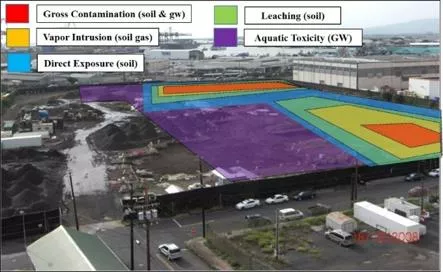
Study #1: Fuel Terminal
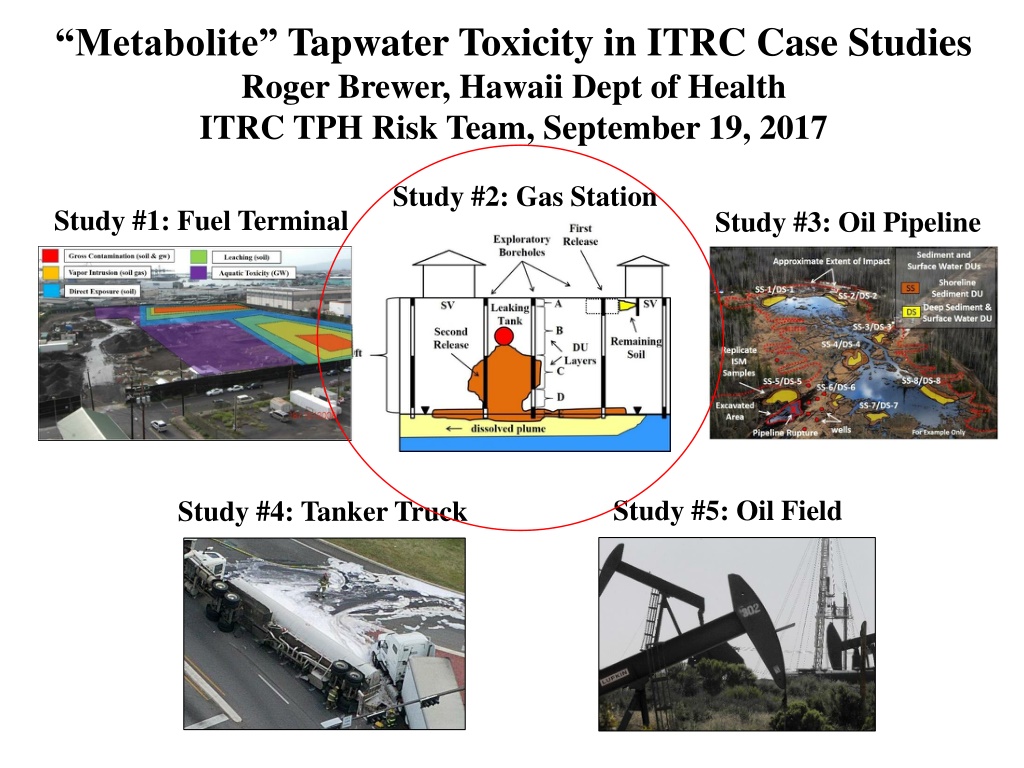
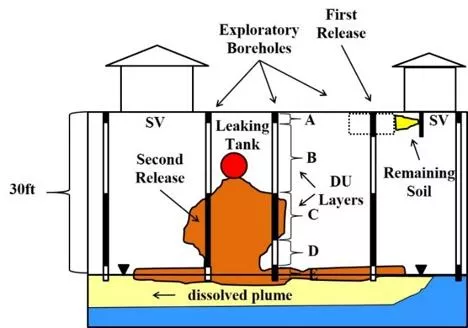
Study #2: Gas Station
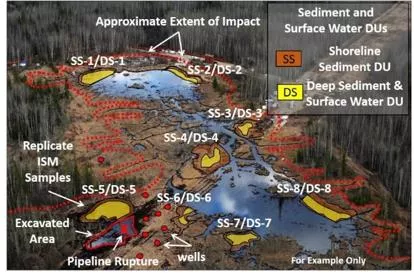
Study #3: Oil Pipeline
Study #4: Tanker Truck
Study #5: Oil Field


References
1. *Zemo et al. 2016.
Life Cycle of Petroleum Biodegradation
Metabolite Plumes, and Implications for Risk Management at
Fuel Release Sites
. Integrated Environmental Assessment and
Management. DOI: 10.1002/ieam.1848
(based on field studies of fuel degradation in groundwater)
2. Case Studies Attachment 5: Example Calculation of
Metabolite Suite-Weighted, Risk-Based Screening Levels
for Tapwater (after Zemo et al. 2016)
Case Study #2: Gas Station
•
Dissolved-phase plume of degraded petroleum migrating offsite;
•
Potential impacts to
shallow, irrigation well at adjacent school
;
•
Sometimes used as source of drinking water by worker and students;
•
Mixed TPH and TPH-related metabolites in source area but
dominated by metabolites downgradient area;
•
Drinking water screening levels?
Site Status: Active
Petroleum Type: Gasoline
Impacted Media: Soil, Soil Vapor, Groundwater
Calculation of Screening Levels
for TPH in Drinking Water
(after HDOH, CAEPA, etc.)
Step 1:
Designate Carbon Ranges and Assign
Toxicity
Factors
Step 2: Estimate Carbon Range Makeup of TPH Fuel Types
Step 3: Calculate Carbon Range-Weighted TPH Toxicity Factors
Step 4:Calculate Carbon Range-Weighted TPH Screening Levels
Calculation of Carbon Range-Weighted
TPH Toxicity Factors & Screening Levels
(after HDOH, CAEPA, etc.)
Step 1
: Example Carbon Range Toxicity
Factors
*Lower number = higher toxicity
RfD = Milligrams of chemical per
kilogram of body weight per day
In English: “Safe” Average Daily Exposure
(assuming
15
k
g Child)
*For example only; not adjusted for
exposure frequency
“Dose Makes the
Poison”
Calculation of Carbon Range-Weighted
TPH Toxicity Factors & Screening Levels
(after HDOH, CAEPA, etc.)
Step 2:
Assumed Carbon Range Makeup of Fuels
Fuels (for example only):
Fuel
Vapors
(for example only)
:
Carbon Range-Weighted Toxicity Factors
(after HDOH, CAEPA)
Step 3
:
*Carbon Range-Weighted TPH Toxicity Factors
*Biased toward more toxic components
Carbon Range-Weighted Toxicity Factors
& Screening Levels
(after HDOH, CAEPA)
Step 4:
Carbon Range-Weighted TPH Screening Levels
*Assumes child water ingestion rate of 0.78 liters/day, 350 days per year
for 6 years.
USEPA RSL Tapwater model (child exposure)
Similar Approach Can (in Theory) be Applied to
TPH-Related Metabolites
in Drinking Water
(Case Studies Attachment 5; based on Zemo et al. 2016)
Step 1:
Designate
Metabolite Families
and
Assign
Toxicity
Factors
Step 2: Estimate
Metabolite Family
Makeup of Degraded TPH
Step 3: Calculate
Metabolite Suite-Weighted
Toxicity Factors
Step 4: *Calculate
Metabolite Suite-Weighted
Screening Levels
Toxicity Ranking of TPH-Related Metabolites
(Zemo et al. 2016)
Step 1
: Metabolite Families & Toxicity
Factors
*Estimated toxicity of ketone and phenol mixtures varies between degradation stages.
•
Oxidized hydrocarbons not significantly volatile;
•
Focus on ingestion route of exposure for tapwater.
Transport Direction and/or Increasing Residence Time
Step 2:
Degradation Stages vs
Metabolite Family Makeup
Degradation Stages (
Zemo et al. 2016)
Step 2:
Degradation Stage vs Metabolite Makeup
(Zemo et al. 2016)
Step 3
:
Metabolite Suite-Weighted Toxicity Factors
*Biased toward more toxic components
Step 4:
Metabolite Suite-Weighted Screening Levels
*Assumes child water ingestion rate of 0.78 liters/day for 350 days per year.
Carbon Range-Weighted Screening Levels
*Assumes child water ingestion rate of 0.78 liters/day for 350 days per year.
For example only!
Example Drinking Water Screening Levels
for TPH-Related Metabolites
(most conservative
toxicity factors applied)
Transport Direction and/or Increasing Residence Time
*Non-degraded, TPH hydrocarbons
must be evaluated separately and
cumulative risk considered.
Summary
•
Weighed carbon range approach
to calculate TPH
screening levels for drinking water in use for 15+ years;
•
Similar approach
possible for TPH-related degradation
compounds (“metabolites”) in drinking water;
•
Focus on
ingestion exposure pathway
(low volatility);
•
Degradation Stage 1 & 2 metabolite suites generate
screening levels
similar to TPH parent compounds
(400-
700 µg/L);
•
Higher screening level
s potentially applicable to Stage 3
& 4 metabolite suites,
assuming proposed toxicity factors
appropriate
(e.g., 1,100-1,400 µg/L);
•
Within or above likely “TPH”
taste and odor threshold
range of 500-1,000 µg/L (i.e., receptor will know water
is contaminated).
Exploring the impact of metabolites from petroleum degradation on tap water toxicity through case studies involving gas stations, fuel terminals, oil pipelines, oil fields, and tanker trucks. The assessment of TPH risk levels in different settings, calculation of screening levels for drinking water, and evaluation of toxicity factors provide insights into managing risks associated with petroleum contamination.

Uploaded on Sep 11, 2024 | 0 Views
Download Presentation

Please find below an Image/Link to download the presentation.
The content on the website is provided AS IS for your information and personal use only. It may not be sold, licensed, or shared on other websites without obtaining consent from the author. Download presentation by click this link. If you encounter any issues during the download, it is possible that the publisher has removed the file from their server.
E N D
Presentation Transcript
Metabolite Tapwater Toxicity in ITRC Case Studies Roger Brewer, Hawaii Dept of Health ITRC TPH Risk Team, September 19, 2017 Study #2: Gas Station Study #1: Fuel Terminal Study #3: Oil Pipeline Study #5: Oil Field Study #4: Tanker Truck
References 1. *Zemo et al. 2016. Life Cycle of Petroleum Biodegradation Metabolite Plumes, and Implications for Risk Management at Fuel Release Sites. Integrated Environmental Assessment and Management. DOI: 10.1002/ieam.1848 (based on field studies of fuel degradation in groundwater) 2. Case Studies Attachment 5: Example Calculation of Metabolite Suite-Weighted, Risk-Based Screening Levels for Tapwater (after Zemo et al. 2016)
Case Study #2: Gas Station Site Status: Active Petroleum Type: Gasoline Impacted Media: Soil, Soil Vapor, Groundwater Dissolved-phase plume of degraded petroleum migrating offsite; Potential impacts to shallow, irrigation well at adjacent school; Sometimes used as source of drinking water by worker and students; Mixed TPH and TPH-related metabolites in source area but dominated by metabolites downgradient area; Drinking water screening levels?
Calculation of Screening Levels for TPH in Drinking Water (after HDOH, CAEPA, etc.) Step 1: Designate Carbon Ranges and Assign Toxicity Factors Step 2: Estimate Carbon Range Makeup of TPH Fuel Types Step 3: Calculate Carbon Range-Weighted TPH Toxicity Factors Step 4:Calculate Carbon Range-Weighted TPH Screening Levels
Calculation of Carbon Range-Weighted TPH Toxicity Factors & Screening Levels (after HDOH, CAEPA, etc.) Step 1: Example Carbon Range Toxicity Factors *Ingestion RfD (mg/kg-day) 0.04 0.01 3.0 0.03 *Inhalation RfC (mg/m3) 0.6 0.1 NA 0.1 Carbon Range C5-C8 aliphatics C9-C18 aliphatics C19+ aliphatics C9-C16 aromatics *Lower number = higher toxicity RfD = Milligrams of chemical per kilogram of body weight per day
In English: Safe Average Daily Exposure (assuming 15 kg Child) *Ingestion (mg/day) 0.6 0.15 45 0.45 81 0.0003 Carbon Range C5-C8 aliphatics C9-C18 aliphatics C19+ aliphatics C9-C16 aromatics Aspirin PCBs *For example only; not adjusted for exposure frequency Dose Makes the Poison
Calculation of Carbon Range-Weighted TPH Toxicity Factors & Screening Levels (after HDOH, CAEPA, etc.) Step 2: Assumed Carbon Range Makeup of Fuels Fuels (for example only): Carbon Range C5-C8 aliphatics C9-C18 aliphatics C19+ aliphatics C9-C16 aromatics TPHgasoline 45% 12% 0% 43% TPHdiesel 0.4% 35% 43% 22% TPHresfuels 0% 0% 75% 25% Fuel Vapors (for example only): Carbon Range C5-C8 aliphatics C9-C18 aliphatics C9-C16 aromatics TPHgasoline 77% 7.3% 15% TPHdiesel 25% 75% 0%
Carbon Range-Weighted Toxicity Factors (after HDOH, CAEPA) Step 3: *Carbon Range-Weighted TPH Toxicity Factors *RfD *RfC (mg/m3) 0.28 0.13 NA Carbon Range TPHg TPHd TPHro (mg/kg-day) 0.03 0.02 0.12 *Biased toward more toxic components
Carbon Range-Weighted Toxicity Factors & Screening Levels (after HDOH, CAEPA) Step 4: Carbon Range-Weighted TPH Screening Levels USEPA RSL Tapwater model (child exposure) TPHg ( g/L) TPHd ( g/L) TPHro ( g/L) *Exposure Pathway Drinking Water (ingestion only) Drinking Water (ingestion + inhalation) *Assumes child water ingestion rate of 0.78 liters/day, 350 days per year for 6 years. 600 400 2,400 300 160 2,400
Similar Approach Can (in Theory) be Applied to TPH-Related Metabolites in Drinking Water (Case Studies Attachment 5; based on Zemo et al. 2016) Step 1: Designate Metabolite Families andAssign Toxicity Factors Step 2: Estimate Metabolite Family Makeup of Degraded TPH Step 3: Calculate Metabolite Suite-Weighted Toxicity Factors Step 4: *Calculate Metabolite Suite-Weighted Screening Levels
Step 1: Metabolite Families & Toxicity Factors Toxicity Ranking of TPH-Related Metabolites (Zemo et al. 2016) Estimated Range Ingestion RfD (mg/kg-day) Low 0.1 0.1 0.01 0.01 0.001 Metabolite Family Alcohols Acids/Esters *Ketones Aldehydes *Phenols *Estimated toxicity of ketone and phenol mixtures varies between degradation stages. Toxicity Ranking Low Low Low/Low-Mod Low to Mod Low/Mod High 1.0 1.0 1.0 0.1 1.0 Oxidized hydrocarbons not significantly volatile; Focus on ingestion route of exposure for tapwater.
Step 2: Degradation Stages vs Metabolite Family Makeup Degradation Stages (Zemo et al. 2016) Stage 4: Downgradient (metabolites only and outside of smear zone) Stage 1: Source Area (dissolved HC + metabolites) Stage 2: Smear Zone (metabolites only, no dissolved HC) Stage 3: Transition Zone (ave Stages 2 & 4) Transport Direction and/or Increasing Residence Time
Step 2: Degradation Stage vs Metabolite Makeup (Zemo et al. 2016) Stage 1 Stage 2 Alcohols Acids/Esters Ketones Aldehydes Phenols Stage 3 Stage 4
Step 3: Metabolite Suite-Weighted Toxicity Factors Estimated Range *Weighted Ingestion RfD (mg/kg-day) Low 0.02 0.04 0.05 0.07 Degradation Stage Stage 1 Stage 2 Stage 3 Stage 4 High 0.20 0.37 0.55 0.69 *Biased toward more toxic components
Step 4: Metabolite Suite-Weighted Screening Levels For example only! *Drinking Water (ingestion only) Most Conservative RfDs Least Conservative RfDs *Assumes child water ingestion rate of 0.78 liters/day for 350 days per year. Stage 1 ( g/L) 420 4,200 Stage 2 ( g/L) 740 7,400 Stage 3 ( g/L) 1,100 11,000 Stage 4 ( g/L) 1,400 14,000 Carbon Range-Weighted Screening Levels TPHg ( g/L) TPHd ( g/L) TPHro ( g/L) *Exposure Pathway Drinking Water (ingestion only) Drinking Water (ingestion + inhalation) *Assumes child water ingestion rate of 0.78 liters/day for 350 days per year. 600 400 2,400 300 160 2,400
Example Drinking Water Screening Levels for TPH-Related Metabolites (most conservative toxicity factors applied) Stage 4: Downgradient (metabolites only) Stage 1: *Source Area (+dissolved HC) Stage 2: Smear Zone (metabolites only) Stage 3: Transition Zone (ave Stages 2 & 4) 1,400 g/L 420 g/L 740 g/L 1,100 g/L Transport Direction and/or Increasing Residence Time *Non-degraded, TPH hydrocarbons must be evaluated separately and cumulative risk considered.
Summary Weighed carbon range approach to calculate TPH screening levels for drinking water in use for 15+ years; Similar approach possible for TPH-related degradation compounds ( metabolites ) in drinking water; Focus on ingestion exposure pathway (low volatility); Degradation Stage 1 & 2 metabolite suites generate screening levels similar to TPH parent compounds (400- 700 g/L); Higher screening levels potentially applicable to Stage 3 & 4 metabolite suites, assuming proposed toxicity factors appropriate (e.g., 1,100-1,400 g/L); Within or above likely TPH taste and odor threshold range of 500-1,000 g/L (i.e., receptor will know water is contaminated).


 be Applied to")