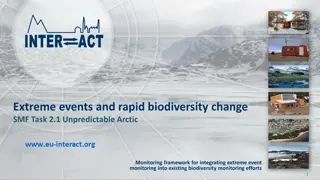
Understanding Biodiversity Monitoring in Changing Habitats
Explore the importance of biodiversity plots in monitoring climate change impacts on species and habitats. Learn about the history and protocols of monitoring projects worldwide, including in Canada. Discover the physical pressures and background issues affecting ecosystems, and the significance of monitoring to mitigate negative impacts and sustain biodiversity for future generations.

Download Presentation

Please find below an Image/Link to download the presentation.
The content on the website is provided AS IS for your information and personal use only. It may not be sold, licensed, or shared on other websites without obtaining consent from the author. Download presentation by click this link. If you encounter any issues during the download, it is possible that the publisher has removed the file from their server.
E N D
Presentation Transcript
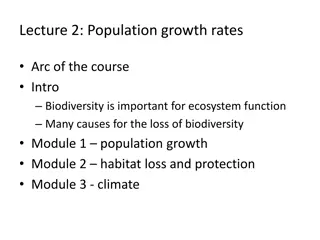
Outline Biodiversity plots History and Description Data collection Results Benefits and Outcomes Recommendations
Biodiversity Plots History Smithsonian Institute Global Climate change monitoring project Canada representation Ontario plots on escarpment Protocol is strict, repeatable and comparable 500 + sites exist worldwide with 104 sites in Canada protocols were created to be long term monitoring projects in partnerships with communities, educators, researchers and other environmental organizations
Why Monitor? As the global climate warms we need to observe and record the well-being of many species within their changing habitats Trees are important sequester carbon and put oxygen back into the atmosphere Monitoring makes us think critically on how trees will be impacted by climate change, and what trees will survive the changes predicted for 2050 and beyond Examining how ecosystems function and the role that biodiversity plays within this habitat can allow for anticipated negative impacts to be mitigated (Dallmeier 2000)
Physical Pressures Increasing Development grade changes, utilities, removal of edge and corridors Disturbance trails, vandalism, bmx ers, encroachment Climate Change drought, insect and disease, changing precipitation patterns,
Richard Jones Park woodland, Mississauga, soil shrinking and cracking June 2007 Benares Museum, Mississauga. Grass dieback July 2007
Historic site visits Bicycle trails Bird watching Picnics Guided tours Non-motor boating Forest activities Wildlife viewing Cross-country skiing Geological site visits Programs & talks Golf Hiking Fishing
Data Collection Students Grade 6 High school University Undergraduates Graduates (Masters and PhD students) City Staff Citizen Scientist
Data Collection Spring and Summer Protocol-based Base-line (Benchmark date 1990) Tree information Species Height Dbh Health Location
Data Collection Web-shared Incorporated in Climate research Analysi Base-line Biodiversity information
Tree Tree ID (Dendrology) Measurements (Mensuration) Math See Nature Mapping (GIS) Communication Meet Experts Teamwork The Spheres of Benefits Exercise Smell Nature Taste Nature Fresh Air Geography Science Hear Nature Touch Nature
Win-Win for ALL! Teachers Students ACER Researchers Environment Canada University Research Smithsonian Institute Global Climate Change Database Citizens
Recommendations Data should be kept in one repository and copies kept with partners such as academic institutions Protocols must be followed to ensure comparability. Share monitoring reports and data with forest managers such as municipal and conservation managers to help them identify risks to their forests as well as to provide input to assist in watershed management Sampling for biodiversity needs to be done using more than 5 plots as it does not accurately represent the species count. Sampling for basal area and stems/hectare using 5 plots was acceptable and yielded comparable results from benchmark data basal area values of the entire 25 quadrats. Establish plots in additional forested areas to better capture forest change in other forest types as well as at locations with differing future climate change characteristics and impacts. Need more eyes in the forest .developing citizen scientists is crucial. future climate change characteristics and impacts.