RAP Incentive System: Revolutionizing Asphalt Recycling
RAP Incentive System, spearheaded by Robert C. Rea, P.E., promotes the use of Reclaimed Asphalt Pavement (RAP) in road construction by offering incentives to contractors. The system aims to address challenges like stockpile management, binder shortages, and escalating costs. Through a structured approach, it incentivizes the use of RAP, leading to cost savings, resource efficiency, and environmental benefits. The system involves reimbursement incentives, binder savings, and a focus on increasing RAP content in asphalt mixes.
Download Presentation

Please find below an Image/Link to download the presentation.
The content on the website is provided AS IS for your information and personal use only. It may not be sold, licensed, or shared on other websites without obtaining consent from the author. Download presentation by click this link. If you encounter any issues during the download, it is possible that the publisher has removed the file from their server.
E N D
Presentation Transcript
RAP Incentive System Robert C. Rea, P.E. Materials and Research robert.rea@nebraska.gov
RAP Incentive System 1. History 2. How it works 3. Post Consumer Recycle Content Label
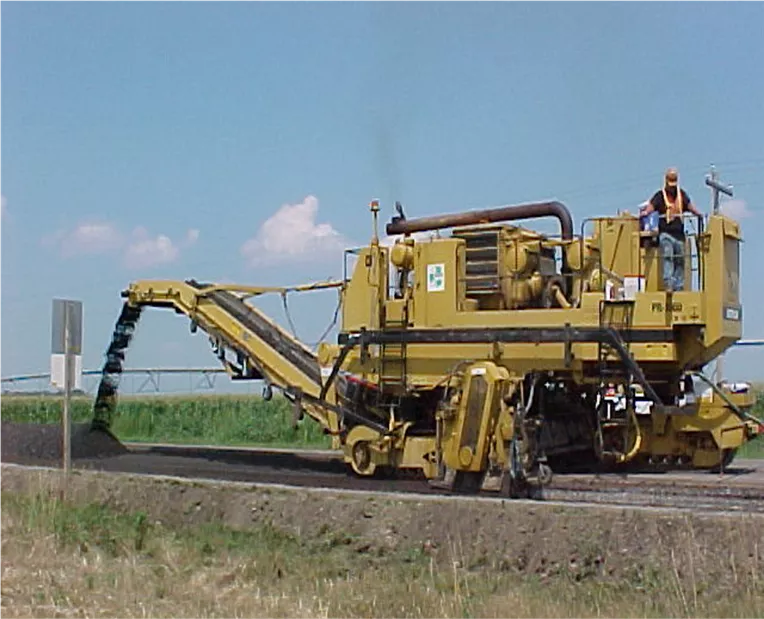
RAP Reclaimed Asphalt Pavement Millings from the roadway 5 % Binder (Oil) 95 % Aggregate
1 Ton of RAP 5 % Binder (Oil) $35/ton 95 % Aggregate $14/ton ____________________ $49/ton material value
Driving factors 1. Millings stockpiles scattered around the state as many as 75 large stockpiles and hundreds of sites some called mountians of millings 2. Couldn t store any more 3. 2008 Polymer and Binder shortage, binder cost doubled
Average RAP Content 30 27.3% RAP 25 20 15 10 6.9% RAP 5 0 2007 2009
How Does it Work ? Binder Savings Incentive RAP Source RAP coming from an ON-project source1 State supplied RAP coming from an OFF-project source2 Contractor supplied RAP3 % Reimbursement 15 35 50 % Incentive To Contractor To NDOT 15 % 35 % 50 % 85 % 65 % 50 % 1 - 2 - 3 -
Example from Contract Perspective Binder $650/Ton Paid as a separate item Mix Design Binder 5.4% RAP from project 5.4% Binder Aggregates $15/Ton Production Costs $25/Ton
Average RAP Contents 37.3%39.2%39.4% 38.8%38.9% 45 34.4% 40 35 28.6% 27.3% 30 25 20 15 6.9% 10 5 0 2007 2009 2010 2011 2012 2013 2014 2015 2016
Annual Savings from RAP Optimization 45.7M46.3M 50 43.6M 41.7M 45 35.3M 40 31.9M 35 23.3M 30 19.8M 25 20 15 3.6M 10 5 0 2007 2009 2010 2011 2012 2013 2014 2015 2016
2008 2018 Recycled Savings 7,000,000 Tons of Aggregate 400,000 Tons of Binder Crude Oil $400,000,000 savings in material costs
Post Consumer Content Label Began using in 2014 In plan sets and Annual Report Show NDOT s commitment to recycling and environmental stewardship Based on quantities of Asphalt and Concrete and calculated recycled contents
NDOT Annual Report
Thank You ! Questions ?
