Understanding Bias and Validity in Statistical Analysis
Understanding Lack
of Validity: Bias
Chance (random error)
◦
statistics are used to reduce it by appropriate
design of the study
◦
statistics are used to estimate the probability that
the observed results are due to chance
Bias (Systematic error)
◦
must be considered in the design of the study
Confounding
◦
can be dealt with during both the design and the
analysis of the study
Causation
During design of study
◦
Sample size
◦
Power
During analysis (Statistical measures of
chance)
◦
Test of statistical significance (P value)
◦
Confidence intervals
the probability the observed results occurred
by chance
statistically non-significant results are not
necessarily attributable to chance due to
small sample size
Power = 1 – type
II
error
Power = 1
0.00001
Clinical Importance
VS
Statistical Significance
20 out of 100 participants: 20%
200 out of 1000 participants: 20%
2000 out of 10000 participants: 20%
What is the difference?
Definition:
A range of values for a variable of
interest constructed so that this range has a
specified probability of including the true value of
the variable for the population
Characteristics:
◦
a measure of the precision (stability) of an observed effect
◦
the range within which the true magnitude of effect lies
with a particular degree of certainty
◦
95% C.I. means that true estimate of effect (mean, risk,
rate) lies within 2 standard errors of the population mean
95 times out of 100
◦
Confidence intervals get smaller (i.e. more precise or more
certain) if the underlying data have less variation/scatter
◦
Confidence intervals get smaller if there are more people in
your sample
20 out of 100 participants: 20%
95% CI: 12 to 28
80 out of 400 participants: 20%
95% CI: 16 to 24
2000 out of 10000 participants: 20%
95% CI: 19.2 to 20.8
Chance (random error)
◦
statistics are used to reduce it by appropriate
design of the study
◦
statistics are used to estimate the probability that
the observed results are due to chance
Bias (Systematic error)
◦
must be considered in the design of the study
Confounding
◦
can be dealt with during both the design and the
analysis of the study
Causation
Any systematic error that results in an
incorrect estimate of the association between
risk factors and outcome
A
systematic error in the design or conduct of
a study.
The definition of bias relates to the process—
that is, the design and procedures—and not
the results of any particular study.
Systematic error results from flaws in either
the (1)
method of selection of study
participants,
or
(2) in the
procedures for gathering
relevant exposure and/or disease
information
Hence - the observed study results will
tend
to be different from the true results
Study design,
Data collection,
Analysis
Interpretation of results
A faulty study design is considered to be
biased (or
invalid) because it will produce an
erroneous result on average
A biased study can produce a result close to
the truth when combined with sampling error
Conversely, an unbiased study can produce
results that are substantially different from
the truth because of random sampling
variability.
Bias is said to exist
when,
on average, the
results of a
hypothetically infinite
number of studies
(related to a specific
association and
reference population)
differ from the true
result
ensuring that the study design—including the
procedures for selection of the study
sample—is appropriate for addressing the
study hypotheses.
establishing and carefully monitoring
procedures of data collection that are valid
and reliable.
using appropriate analytic procedures.
Selection bias – identification of individual
subjects for inclusion in study on the basis
of
either exposure
or
disease status
depends in some way on the other axis of
interest
Iinformation bias – results from
systematic
differences
in the way data on exposure or
outcome are obtained from the various
study groups
is present when
individuals have different
probabilities of being
included in the study
sample according to
relevant study
characteristics-namely,
the exposure and the
outcome of interest.
results from a
systematic tendency
for individuals
selected for
inclusion in the
study to be
erroneously placed
in different
exposure/outcome
categories, thus
leading to
misclassification.
Selection bias occurs when a
systematic error in the
ascertainment of study subjects
(cases or controls in case-control
studies, or exposed or unexposed
subjects in cohort studies) results
in a tendency toward distorting
the measure expressing the
association between exposure and
outcome. (Berksonian bias)
Because differential bias of the type
exemplified in Table 4-3 distorts the nature
or magnitude of an association,
investigators often attempt to "equalize"
bias between the groups under comparison.
In retrospective studies, for example,
attempts are often made to obtain samples
of cases and controls undergoing the same
selection processes.
Healthy worker effect
: In a cohort study,
because study participants (exposed or
unexposed) are selected
before
the
disease actually occurs,
differential
selection according to disease status is
less likely to occur
. Nevertheless,
selection bias may occur
at the outset of
a cohort study when, for example,
a
group of persons exposed to an
occupational hazard is compared with a
sample of the general population
.
Differential losses to follow-up
In
case-control studies
, Choose controls
from
the same “study-base”
as cases.
In
cohort studies
, the
rate of loss to follow-
up
indicates the potential for selection bias.
Comparison of the characteristics of those
lost to follow-up with those persons
remaining under follow-up, may indicate
the potential consequences of any selection
bias.
Information bias in epidemiologic studies
results from either
imperfect definitions
of study variables
or
flawed data
collection procedures
. These errors may
result in misclassification of exposure
and/or outcome status
for a significant
proportion of study participants.
A classic example is: recall bias, in which
the ability to recall past exposure is
dependent on case or control status.
Cases may be more likely than controls
to overstate past exposure
Diseased
Exposed
+ -
+
-
REFERENCE
POPULATION
STUDY SAMPLE
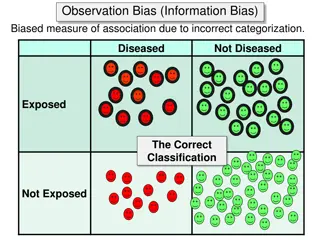
The direction of the association is a
function of which cell(s) are subjected to
a higher or lower probability
Eg...unexposed cases in this
example tend to mistakenly
report past exposure to a greater
extent than do controls
Cases Control
Misclassification of EXPOSURE
Diseased
Exposed
+ -
+
-
REFERENCE
POPULATION
STUDY SAMPLE
Eg…cases in this are mistakenly
classified as controls due to low
sensitivity on a screening test
Cases Control
Misclassification of OUTCOME
Exposure Identification Bias
◦
Recall bias
◦
Interviewer bias
Outcome Identification Bias
◦
Observer bias
◦
Respondent bias
Most cited: inaccurate recall of past
exposure (may be due to temporality,
social desirability or diagnosis).
If recall differs between cases and
controls, misclassification is
differential
;
If the error is of similar magnitude, then
it is said to be
non-differential
1.
Verification of exposure information from
participants by review of
pre-existing records.
2.
Selection of diseased controls
and
compensating this bias.
3.
Objective markers
of exposure or susceptibility
(for example- genetic markers).
4.
Nested case-control
studies allow evaluation of
exposures prior to “case” status.
May occur when interviewers are not
blinded to disease status.
◦
They may probe more
Interviewers may be biased toward the
study hypothesis (or have other biases).
◦
They may ignore protocols
When data collection in a case-control study is
not masked with regard to the disease status of
study participants, observer bias in ascertaining
exposure, such as interviewer bias, may occur.
Interviewer bias may be a consequence of
trying
to "clarify" questions when such clarifications
are not part of the study protocol
,
failing to
follow the protocol-determined probing
, or
skipping rules of questionnaires
.
1.
Reliability and validity substudies in samples
with
quick feedback to interviewers
who do not
follow the protocol or who have encountered
problems.
2.
validity studies
using independent sources
(e.g., medical charts) can be conducted to
assess accuracy of data collection by
interviewers.
3.
Masking of interviewers
with regard to case-
control status of study participants.
may be due to
an imperfect definition of the
outcome
or
to errors at the data collection
stage
.
Two main examples:
◦
Observer bias
◦
Respondent bias
In a Cohort study: decision to classify outcome may be
affected by knowledge of exposure status. Especially
“soft” outcomes such as migraine, or psychiatric
symptoms
Eg: assignment of diagnosis of hypertensive end-stage
renal disease (ESRD). Nephrologists sent case histories
were twice as likely to diagnose “black” patients with ESRD
than “white” patients”.
Masking observers in charge of deciding
whether the outcome is present by
exposure status
.
stratifying on certainty of diagnosis.
Multiple observers
Synonym of recall bias in cohort studies.
outcome ascertainment bias may occur during
follow-up of a cohort when information on the
outcome is obtained by participant response:
for example, when collecting information on
events for which it is difficult to obtain objective
confirmation, such as episodes of migraine
headaches.
In a Cohort study: respondents may
respond with little consistency to un-
standardized questions or to “subjective”
questions.
Eg. Questions about depression may be
very subjective. A solution is to use a
standardized instrument.
Statistical analysis involves considerations of chance, bias, confounding, causation, sample size, and power to ensure valid results. Understanding the impact of these factors is crucial for accurate interpretation of study outcomes and decision-making processes.

Download Presentation

Please find below an Image/Link to download the presentation.
The content on the website is provided AS IS for your information and personal use only. It may not be sold, licensed, or shared on other websites without obtaining consent from the author. Download presentation by click this link. If you encounter any issues during the download, it is possible that the publisher has removed the file from their server.
E N D
Presentation Transcript
Understanding Lack of Validity: Bias Understanding Lack of Validity: Bias
Chance (random error) statistics are used to reduce it by appropriate design of the study statistics are used to estimate the probability that the observed results are due to chance Bias (Systematic error) must be considered in the design of the study Confounding can be dealt with during both the design and the analysis of the study Causation Chance (random error) Bias (Systematic error) Confounding Causation
During design of study Sample size Power During analysis (Statistical measures of chance) Test of statistical significance (P value) Confidence intervals During design of study During analysis (Statistical measures of chance)
Actual Truth of H Actual Truth of H0 0 Decision Decision H H0 0 is true is true H H0 0 is false is false Do not reject H0 Correct Decision Type II Error Type II Error Reject H0 Type I Error Type I Error Correct Decision
the probability the observed results occurred by chance statistically non-significant results are not necessarily attributable to chance due to small sample size
Power = 1 type II error Power = 1
0.00001 Clinical Importance VS Statistical Significance
20 out of 100 participants: 20% 200 out of 1000 participants: 20% 2000 out of 10000 participants: 20% What is the difference?
Definition: interest constructed so that this range has a specified probability of including the true value of the variable for the population Characteristics: a measure of the precision (stability) of an observed effect the range within which the true magnitude of effect lies with a particular degree of certainty 95% C.I. means that true estimate of effect (mean, risk, rate) lies within 2 standard errors of the population mean 95 times out of 100 Confidence intervals get smaller (i.e. more precise or more certain) if the underlying data have less variation/scatter Confidence intervals get smaller if there are more people in your sample Definition: A range of values for a variable of Characteristics:
20 out of 100 participants: 20% 95% CI: 12 to 28 80 out of 400 participants: 20% 95% CI: 16 to 24 2000 out of 10000 participants: 20% 95% CI: 19.2 to 20.8
Chance (random error) statistics are used to reduce it by appropriate design of the study statistics are used to estimate the probability that the observed results are due to chance Bias (Systematic error) must be considered in the design of the study Confounding can be dealt with during both the design and the analysis of the study Causation Chance (random error) Bias (Systematic error) Confounding Causation
Any systematic error that results in an incorrect estimate of the association between risk factors and outcome A systematic error in the design or conduct of a study. The definition of bias relates to the process that is, the design and procedures and not the results of any particular study.
Systematic error results from flaws in either the (1) method of selection of study participants, or (2) in the procedures for gathering relevant exposure and/or disease information Hence - the observed study results will tend to be different from the true results
Study design, Data collection, Analysis Interpretation of results
A faulty study design is considered to be biased (or invalid) because it will produce an erroneous result on average A biased study can produce a result close to the truth when combined with sampling error Conversely, an unbiased study can produce results that are substantially different from the truth because of random sampling variability.
Bias is said to exist when, on average, the results of a hypothetically infinite number of studies (related to a specific association and reference population) differ from the true result
ensuring that the study designincluding the procedures for selection of the study sample is appropriate for addressing the study hypotheses. establishing and carefully monitoring procedures of data collection that are valid and reliable. using appropriate analytic procedures.
Selection bias identification of individual subjects for inclusion in study on the basis of either exposure or disease status depends in some way on the other axis of interest Iinformation bias results from systematic differences in the way data on exposure or outcome are obtained from the various study groups
is present when individuals have different probabilities of being included in the study sample according to relevant study characteristics-namely, the exposure and the outcome of interest.
results from a systematic tendency for individuals selected for inclusion in the study to be erroneously placed in different exposure/outcome categories, thus leading to misclassification.
Selection bias occurs when a systematic error in the ascertainment of study subjects (cases or controls in case-control studies, or exposed or unexposed subjects in cohort studies) results in a tendency toward distorting the measure expressing the association between exposure and outcome. (Berksonian bias)
Because differential bias of the type exemplified in Table 4-3 distorts the nature or magnitude of an association, investigators often attempt to "equalize" bias between the groups under comparison. In retrospective studies, for example, attempts are often made to obtain samples of cases and controls undergoing the same selection processes.
Healthy worker effect: In a cohort study, because study participants (exposed or unexposed) are selected before the disease actually occurs, differential selection according to disease status is less likely to occur. Nevertheless, selection bias may occur at the outset of a cohort study when, for example, a group of persons exposed to an occupational hazard is compared with a sample of the general population. Differential losses to follow-up
In case-control studies, Choose controls from the same study-base as cases. In cohort studies, the rate of loss to follow- up indicates the potential for selection bias. Comparison of the characteristics of those lost to follow-up with those persons remaining under follow-up, may indicate the potential consequences of any selection bias.
Information bias in epidemiologic studies results from either imperfect definitions of study variables or flawed data collection procedures. These errors may result in misclassification of exposure and/or outcome status for a significant proportion of study participants. A classic example is: recall bias, in which the ability to recall past exposure is dependent on case or control status. Cases may be more likely than controls to overstate past exposure
Misclassification of EXPOSURE REFERENCE POPULATION Diseased + - The direction of the association is a function of which cell(s) are subjected to a higher or lower probability + Exposed - Cases Control Eg...unexposed cases in this example tend to mistakenly report past exposure to a greater extent than do controls STUDY SAMPLE
Misclassification of OUTCOME REFERENCE POPULATION Diseased + - + Exposed - Cases Control STUDY SAMPLE Eg cases in this are mistakenly classified as controls due to low sensitivity on a screening test
Exposure Identification Bias Recall bias Interviewer bias Outcome Identification Bias Observer bias Respondent bias
Most cited: inaccurate recall of past exposure (may be due to temporality, social desirability or diagnosis). If recall differs between cases and controls, misclassification is differential; If the error is of similar magnitude, then it is said to be non-differential
Verification of exposure information from participants by review of pre-existing records. Selection of diseased controls and compensating this bias. Objective markers of exposure or susceptibility (for example- genetic markers). Nested case-control studies allow evaluation of exposures prior to case status. 1. 2. 3. 4.
May occur when interviewers are not blinded to disease status. They may probe more Interviewers may be biased toward the study hypothesis (or have other biases). They may ignore protocols
When data collection in a case-control study is not masked with regard to the disease status of study participants, observer bias in ascertaining exposure, such as interviewer bias, may occur. Interviewer bias may be a consequence of trying to "clarify" questions when such clarifications are not part of the study protocol, failing to follow the protocol-determined probing, or skipping rules of questionnaires.
Reliability and validity substudies in samples with quick feedback to interviewers who do not follow the protocol or who have encountered problems. validity studies using independent sources (e.g., medical charts) can be conducted to assess accuracy of data collection by interviewers. Masking of interviewers with regard to case- control status of study participants. 1. 2. 3.
may be due to an imperfect definition of the outcome or to errors at the data collection stage. Two main examples: Observer bias Respondent bias
In a Cohort study: decision to classify outcome may be affected by knowledge of exposure status. Especially soft outcomes such as migraine, or psychiatric symptoms Eg: assignment of diagnosis of hypertensive end-stage renal disease (ESRD). Nephrologists sent case histories were twice as likely to diagnose black patients with ESRD than white patients .
Masking observers in charge of deciding whether the outcome is present by exposure status. stratifying on certainty of diagnosis. Multiple observers
Synonym of recall bias in cohort studies. outcome ascertainment bias may occur during follow-up of a cohort when information on the outcome is obtained by participant response: for example, when collecting information on events for which it is difficult to obtain objective confirmation, such as episodes of migraine headaches.
In a Cohort study: respondents may respond with little consistency to un- standardized questions or to subjective questions. Eg. Questions about depression may be very subjective. A solution is to use a standardized instrument.

")


")