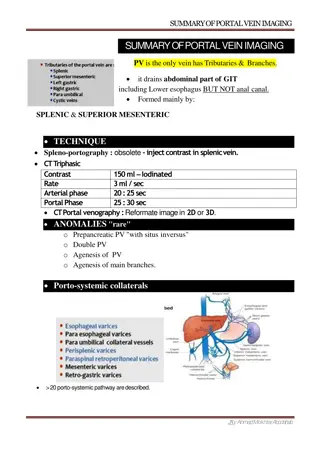
Understanding Intracardiac Shunts: Illustrated Overview
This content provides an illustrated explanation of intracardiac shunts, including simple and complex shunts, pathological consequences, anesthetic management effects, and case presentations. It covers the hemodynamic and physiologic aspects of intracardiac shunting, emphasizing the importance of understanding Qp/Qs ratios and common shunting lesions. The visuals help clarify the flow of oxygenated and deoxygenated blood within the heart chambers, offering a comprehensive understanding of this cardiovascular condition.

Download Presentation

Please find below an Image/Link to download the presentation.
The content on the website is provided AS IS for your information and personal use only. It may not be sold, licensed, or shared on other websites without obtaining consent from the author. Download presentation by click this link. If you encounter any issues during the download, it is possible that the publisher has removed the file from their server.
E N D
Presentation Transcript
Understanding Intracardiac Shunts Denise Joffe, MD
Objectives To explain intracardiac shunting using illustrations To describe the hemodynamic and physiologic consequences of intracardiac shunting
Outline Describe simple (unidirectional) shunts Describe complex (bidirectional) shunts Describe the pathological consequences of shunting Describe how anesthetic management is effected by intracardiac shunts Case presentations
Qp/Qs Differs from Qs/Qt (intrapulmonary shunt) Is a result of abnormal intracardiac communications (see below for exception) What s yours?
In order to understand intracardiac shunts you must understand Qp/Qs (ratio of pulmonary to systemic blood flow)
Understanding Simple Intracardiac Shunts Lesions with isolated L R or R L shunts Eg. atrial septal defect (ASD), ventricular septal defect (VSD), atrioventricular canal (AVC), PDA (patent ductus arteriosus) tetralogy of Fallot (TOF)
In the following diagrams the arrows represents blood flow. represents deoxygenated systemic venous blood flow (normal saturation about 65-75%) represents oxygenated pulmonary venous blood flow (normal saturation about 97-100%) represents an admixture of deoxygenated and oxygenated blood flow (saturation approx between 80-95%) The size of the arrow represents the relative amount of flow in (Liters/min)
L R Shunts (ASD) QsSVC QPV QsIVC ASD RA LA LV RV PA Ao Qs Qp
L R Shunts QsSVC QPV QsIVC ASD RA LA LV RV PA Qp Qs Qp>>Qs and Qp is more oxygenated than normal.
Effective pulmonary blood flow (PBF), recirculated PBF and total PBF QsSVC QPV QsIVC LA RA b Effective PBF = systemic (blue) blood that goes to the lungs (a) RV a+b Recirculated PBF= PV (red) blood that goes back to the lungs i.e. L -> R shunt (b) Qp total=PBFeffective+PBFrecirc OR PA Ao Qp total=PBFeffective+L -> R shunt Qp Qs Qp>>>Qs
R L Shunts QsSVC QPV TOF QsIVC RA LA LV RV Qp Qs PA Ao
R L Shunts QsSVC QPV TOF QsIVC RA LA LV RV Ao Qp Qs PA Qp<<Qs and Qs is less oxygenated than it should be
Effective systemic blood flow (SBF), recirculated SBF and total SBF QsSVC QPV Effective SBF= pulmonary venous blood (red) that goes out the aorta (a-b) QsIVC a LA RA Recirculated SBF = blue blood that goes out the aorta i.e.R -> L shunt (b) RV LV b a-b Qs total= SBF effective +SBF recirc Ao OR PA Qp Qs total= SBF effective + R -> L shunt Qs
Understanding Complex (Bidirectional) Intracardiac Shunts Due to crossover of flow, SaO2 is lower than expected and SpaO2 is higher than expected. Eg. transposition of the great arteries (TGA), single ventricle, total anomalous pulmonary venous drainage (TAPVD), truncus arteriosus
Bidirectional Shunting (single ventricle) QsSVC QPV QsIVC atrium SV PA Ao Ao
Bidirectional shunting QsSVC QPV QsIVC atrium SV Qp PA Ao Ao Qp is redder than it should be and Qs is bluer than it should be. Therefore this is a complex bidirectional shunt. Also, note Qp>>Qs.
Consequences of Shunts Depending on the direction and amount of the shunt: Pulmonary overcirculation resulting in CHF, pulmonary hypertension, pulmonary vascular disease Ventricular volume overload and increased myocardial work which can lead to cardiogenic shock Hypoxia
Anesthesia and Cardiac Shunting Ventilation and acid/base management can alter PVR and increase or decrease PBF. In the OR, FiO2, pH (via pCO2), and medication (narcotic, milrinone, nitric oxide) are used most frequently to alter PVR. SVR can be altered with vasopressors/vasodilators. It is crucial to de-air lines and be vigilant for emboli in the presence of any shunt.
Ready for some numbers? Due to intracardiac shunts, systemic and pulmonary flows cannot be calculated with thermodilution techniques. Systemic and pulmonary cardiac outputs are calculated with the Fick equation: Qs=VO2/CaO2-CvO2 Qp=VO2/CpvO2-CpaO2
VO2 is oxygen consumption. CaO2 is the oxygen content of arterial blood: Hg(gm) X 1.36(mlO2/gm Hg) X arterial saturation+dissolved oxygen Use the same formula to calculate mixed venous, pulmonary venous and pulmonary artery oxygen contents, by substituting their saturation value.
Qs=VO2 / Hg X 1.36 X {(SaO2-SvO2)} X10 (factor to correct for units) Qp=VO2 / Hg X 1.36 X {(SpvO2 -SpaO2)} X10 With some simple algebra the above equation can be re-written Qp/Qs=SaO2-SvO2 / SpvO2 -SpaO2 The SpvO2 is usually estimated to be about 97% in the absence of lung disease. A mixed venous, PA and Ao saturation are necessary.
Example #1 - Simple shunt 6 month old male with a VSD, VO2 75 ml/min, SVC 70%, IVC 70%, PA 87%, Ao 99%, PV 99%, Hg 11 g/dl Qs=1.7 L/min; Qp=4.2 L/min
L R Shunts QsSVC QPV QsIVC 1.7 L/min 4.2 L/min RA LA LV RV VSD PA Ao Qp Qs 1.7 L/min 4.2 L/min Qp:Qs= 2.5:1
L R Shunts QsSVC QPV QsIVC 1.7 L/min 4.2 L/min RA LA Qp/Qs=4.2/1.7=2.5:1 Qp total=PBFeffective+L R shunt LV RV L -> R shunt= Qp- PBFeffective 2.5 L/min VSD PA Ao Qp Qs 1.7 L/min L -> R shunt= 4.2-1.7 L -> R shunt = 2.5L/min 4.2 L/min
Example #2 - Bidirectional shunt 3 day old baby with hypoplastic left heart syndrome. VO2 50 ml/min, SVC 65%, IVC 65%, PA 87%, Ao 87%, PV 100%, Hg 13 g/dl Qs=1.3 L/min; Qp=2.2 L/min
Bidirectional shunting - calculating effective PBF and R L shunt QsSVC QPV 1.3L/min Q R L = Qs-QPBF effective Q R L =1.3-0.8 Q R L =0.5L/min QsIVC atrium Q PBF effective 0.8 L/min SV PA Ao Ao 2.2 L/min 1.3L/min A new equation is used to calculate effective PBF in patients with bidirectional shunting. Q PBF effective = VO2/CpvO2-CvO2
Bidirectional shunting-calculating effective SBF and L R shunt QsSVC QPV 1.3L/min 2.2L/min QsIVC atrium Q SBF effective 0.8 L/min SV Q L -> R = Qp-QPBF effective Q L -> R=2.2-0.8 Q L -> R =1.4L/min PA Ao Ao 2.2 L/min 1.3L/min
Bidirectional shunting QsSVC QPV Q R L = Qs-QPBF effective Q R L =1.3-0.8 Q R L =0.5L/min 1.3L/min 2.2L/min QsIVC Q L -> R = Qp-QPBF effective Q L -> R=2.2-0.8 Q L ->R =1.4L/min atrium Q PBF effective 0.8 L/min Q SBF effective 0.8 L/min SV PA Ao Ao 2.2 L/min 1.3L/min Note that Q PBF effective always equals Q SBF effective . The SV has a cardiac output 3.5L/min (Qp+Qs) but only 1.6L/min is going to the correct place (effective blood flows)
Objectives To explain intracardiac shunting using illustrations To describe the hemodynamic and physiologic consequences of intracardiac shunting


")


,")


} X10 (factor to")