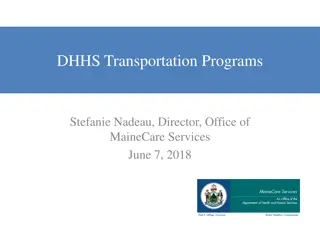
Climate Change Impacts on U.S. Transportation Infrastructure
The Fourth National Climate Assessment reveals the risks climate change poses to the U.S. transportation system. Heavy precipitation, coastal flooding, heat, and wildfires threaten the reliability, safety, and efficiency of transportation infrastructure, leading to societal and economic consequences. Engineers and planners are focusing on vulnerability assessments to understand and address these risks. Regional variations in climate impacts further underscore the urgent need for adaptive measures to safeguard transportation assets and services.

Download Presentation

Please find below an Image/Link to download the presentation.
The content on the website is provided AS IS for your information and personal use only. It may not be sold, licensed, or shared on other websites without obtaining consent from the author. Download presentation by click this link. If you encounter any issues during the download, it is possible that the publisher has removed the file from their server.
E N D
Presentation Transcript
Fourth National Climate Assessment, Vol II Impacts, Risks, and Adaptation in the United States Chapter 12 | Transportation Fourth National Climate Assessment, Vol II Impacts, Risks, and Adaptation in the United States nca2018.globalchange.gov 1
Ch. 12 | Transportation Key Message #1 12 Transportation at Risk A reliable, safe, and efficient U.S. transportation system is at risk from increases in heavy precipitation, coastal flooding, heat, wildfires, and other extreme events, as well as changes to average temperature. Throughout this century, climate change will continue to pose a risk to U.S. transportation infrastructure, with regional differences. Fourth National Climate Assessment, Vol II Impacts, Risks, and Adaptation in the United States nca2018.globalchange.gov 2
Ch. 12 | Transportation Key Message #2 12 Impacts to Urban and Rural Transportation Extreme events that increasingly impact the transportation network are inducing societal and economic consequences, some of which disproportionately affect vulnerable populations. In the absence of intervention, future changes in climate will lead to increasing transportation challenges, particularly because of system complexity, aging infrastructure, and dependency across sectors. Fourth National Climate Assessment, Vol II Impacts, Risks, and Adaptation in the United States nca2018.globalchange.gov 3
Ch. 12 | Transportation Key Message #3 12 Vulnerability Assessments Engineers, planners, and researchers in the transportation field are showing increasing interest and sophistication in understanding the risks that climate hazards pose to transportation assets and services. Transportation practitioner efforts demonstrate the connection between advanced assessment and the implementation of adaptive measures, though many communities still face challenges and barriers to action. Fourth National Climate Assessment, Vol II Impacts, Risks, and Adaptation in the United States nca2018.globalchange.gov 4
Ch. 12 | Transportation Fig. 12.1: U.S. Transportation Assets and Goals at Risk Heavy precipitation, coastal flooding, heat, and changes in average precipitation and temperature affect assets (such as roads and bridges) across all modes of transportation. The figure shows major climate-related hazards and the transportation assets impacted. Photos illustrate national performance goals (listed in 23 U.S.C. 1508) that are at risk due to climate-related hazards. Source: USGCRP. Photo credits from left to right: JAXPORT, Meredith Fordham Hughes [CC BY-NC 2.0]; Oregon Department of Transportation [CC BY 2.0]; NPS Mississippi National River and Recreation Area; Flickr user Tom Driggers [CC BY 2.0]; Flickr user Mike Mozart [CC BY 2.0]; Flickr user Jeff Turner [CC BY 2.0]; Flickr user William Garrett [CC BY 2.0]. Fourth National Climate Assessment, Vol II Impacts, Risks, and Adaptation in the United States nca2018.globalchange.gov 5
Ch. 12 | Transportation Fig. 12.2: Annual Vehicle-Hours of Delay Due to High Tide Flooding The figure shows annual vehicle- hours of delay for major roads (principal arterials, minor arterials, and major collectors) due to high tide flooding by state, year, and sea level rise scenario (from Sweet et al. 2017).59Years are shown using decadal average (10-year) values (that is, 2020 is 2016 2025), except 2100, which is a 5-year average (2096 2100). One vehicle-hour of delay is equivalent to one vehicle delayed for one hour. Source: Jacobs et al. 2018,61Figure 3, reproduced with permission of the Transportation Research Board. Fourth National Climate Assessment, Vol II Impacts, Risks, and Adaptation in the United States nca2018.globalchange.gov 6
Ch. 12 | Transportation Fig. 12.3: Transportation Vulnerability and Risk Assessments This figure shows transportation vulnerability and/or risk assessments from 2012 to 2016 by location. Cumulatively, these vulnerability assessments elucidate national-scale vulnerabilities and progress. Data for the U.S. Caribbean region were not available. See the online version of this map at http://nca2018.globalchange.gov/chapter/12#fig-12-3 to access the complete set of vulnerability and risk assessments. Sources: ICF and U.S. Department of Transportation. Fourth National Climate Assessment, Vol II Impacts, Risks, and Adaptation in the United States nca2018.globalchange.gov 7
Ch. 12 | Transportation Fig. 12.4: Flood Impacts on Colorado Highway Flooding events can result in serious damage to road infrastructure. Here, debris flow covers US Highway 14 (Poudre Canyon) after the High Park Fire in 2012. Photo credit: Justin Pipe, Colorado Department of Transportation. Fourth National Climate Assessment, Vol II Impacts, Risks, and Adaptation in the United States nca2018.globalchange.gov 8
Ch. 12 | Transportation Chapter Author Team 12 Anne Choate, ICF Susanne DesRoches, New York City Mayor s Office of Recovery and Resiliency and Office of Sustainability Scott Douglass, South Coast Engineers Rawlings Miller, WSP, (formerly U.S. Department of Transportation Volpe Center) Federal Coordinating Lead Author Michael Culp, U.S. Department of Transportation, Federal Highway Administration Chapter Lead Jennifer M. Jacobs, University of New Hampshire Chapter Authors Lia Cattaneo, Harvard University (formerly U.S. Department of Transportation) Paul Chinowsky, University of Colorado Boulder Review Editor Jesse Keenan, Harvard University Fourth National Climate Assessment, Vol II Impacts, Risks, and Adaptation in the United States nca2018.globalchange.gov 9
Ch. 12 | Transportation Acknowledgments 12 USGCRP Coordinators Allyza Lustig, Program Coordinator Kristin Lewis, Senior Scientist Fourth National Climate Assessment, Vol II Impacts, Risks, and Adaptation in the United States nca2018.globalchange.gov 10
Recommended chapter citation Jacobs, J.M., M. Culp, L. Cattaneo, P. Chinowsky, A. Choate, S. DesRoches, S. Douglass, and R. Miller, 2018: Transportation. In Impacts, Risks, and Adaptation in the United States: Fourth National Climate Assessment, Volume II [Reidmiller, D.R., C.W. Avery, D.R. Easterling, K.E. Kunkel, K.L.M. Lewis, T.K. Maycock, and B.C. Stewart (eds.)]. U.S. Global Change Research Program, Washington, DC, USA. doi: 10.7930/NCA4.2018.CH12 Read the full chapter https://nca2018.globalchange.gov/chapter/transportation nca2018.globalchange.gov Fourth National Climate Assessment, Vol II Impacts, Risks, and Adaptation in the United States nca2018.globalchange.gov 11