Channel Generation Process for IEEE 802.11aj (45GHz) Based on Channel Measurement
This presentation by Haiming Wang and team from SEU/CWPAN discusses the process of channel realization and generation in the 45 GHz bandwidth. It covers the generation of the channel impulse response, modeling of parameters, statistical measurements, and future work related to the 802.11ad standard. The content includes details on amplitude, phase, time parameters for the channel, including antenna models and beamforming algorithms. The presentation outlines the steps for channel impulse response generation, including intra-cluster parameters and applying antenna models for channel realization.

Download Presentation

Please find below an Image/Link to download the presentation.
The content on the website is provided AS IS for your information and personal use only. It may not be sold, licensed, or shared on other websites without obtaining consent from the author. Download presentation by click this link. If you encounter any issues during the download, it is possible that the publisher has removed the file from their server.
E N D
Presentation Transcript
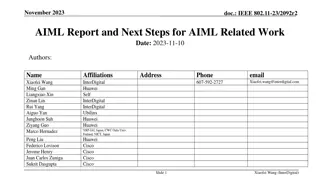
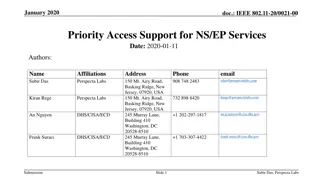
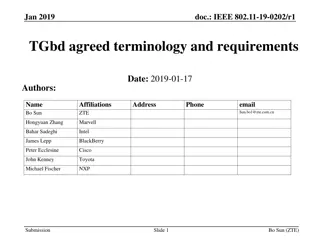
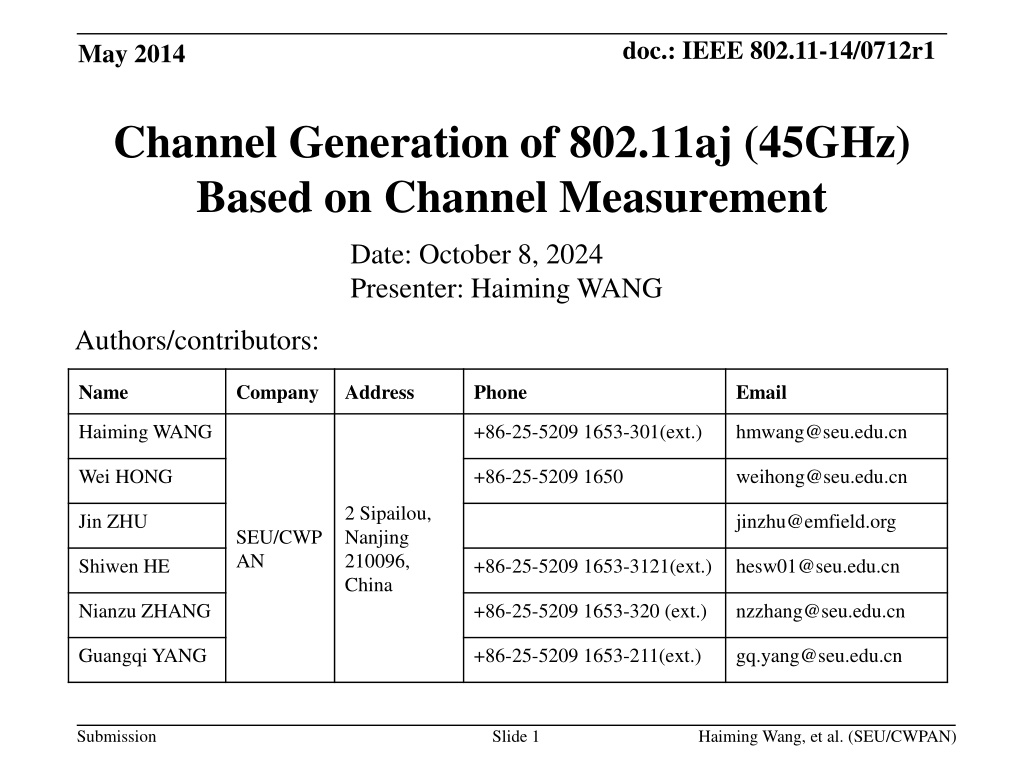
doc.: IEEE 802.11-14/0712r1 May 2014 Channel Generation of 802.11aj (45GHz) Based on Channel Measurement Date: October 8, 2024 Presenter: Haiming WANG Authors/contributors: Name Company Address Phone Email Haiming WANG +86-25-5209 1653-301(ext.) hmwang@seu.edu.cn Wei HONG +86-25-5209 1650 weihong@seu.edu.cn 2 Sipailou, Nanjing 210096, China Jin ZHU jinzhu@emfield.org SEU/CWP AN Shiwen HE +86-25-5209 1653-3121(ext.) hesw01@seu.edu.cn Nianzu ZHANG +86-25-5209 1653-320 (ext.) nzzhang@seu.edu.cn GuangqiYANG +86-25-5209 1653-211(ext.) gq.yang@seu.edu.cn Submission Slide 1 Haiming Wang, et al. (SEU/CWPAN)
doc.: IEEE 802.11-14/0712r1 May 2014 Abstract This presentation gives process of channel realization generation of 45 GHz band. Submission Slide 2 Haiming Wang, et al. (SEU/CWPAN)
doc.: IEEE 802.11-14/0712r1 May 2014 Outline Review of generation of the channel impulse response of 11ad Realization process Modeling of parameters Statistical measurement at 45 GHz band Measurement process Modeling Future work Submission Slide 3 Haiming Wang, et al. (SEU/CWPAN)
doc.: IEEE 802.11-14/0712r1 May 2014 CIR Generation of 802.11ad Amplitude, phase, and time parameters for all rays of the channel after application of antenna models Amplitude, phase, angular and time parameters for all rays of the channel Amplitude, time, and angular parameters for available (non- blocked) clusters Amplitude, time, and angular characteristics for all possible clusters Channel impulse response for the specified sample rate Model input parameters Generate all possible clusters and inter cluster parameters Apply antenna models and beamforming algorithms Convert to discrete time and normalize if needed Start channel impulse response generation Finish impulse response generation Generate intra cluster parameters Block part of the clusters Input from baseband to beamforming algorithms (e.g. weight vector for antenna array) Fig 1. Process of channel realization generation Submission Slide 4 Haiming Wang, et al. (SEU/CWPAN)
doc.: IEEE 802.11-14/0712r1 May 2014 CIR Generation of 802.11ad General structure of channel model: ( ) ( ) i = ( ) ( ) ( ) ( ) ( ) ( ) ( ) i i i i i i i , , , , , , , , h t A C t T tx tx rx rx tx tx tx tx rx rx rx rx ( ) ( ) ( ) ( ) ( ) ( ) k = ( ) ( , ) ( , ) ( , ) ( , ) ( , ) ( , ) i i k i k i k i k i k i k , , , , C t t tx tx rx rx tx tx tx tx rx rx rx rx where: h is a generated channel impulse response. t, tx, tx, rx, rxare time and azimuth and elevation angles at the transmitter and receiver, respectively. A(i)and C(i)are the gain and the channel impulse response for i-th cluster respectively. ( )- is the Dirac delta function. T(i), tx(i), tx(i), rx(i), rx(i)are time-angular coordinates of i-th cluster. (i,k)is the amplitude of the k-th ray of i-th cluster (i,k), tx(i,k), tx(i,k), rx(i,k), rx(i,k)are relative time-angular coordinates of k-th ray of i- th cluster. Submission Slide 5 Haiming Wang, et al. (SEU/CWPAN)
doc.: IEEE 802.11-14/0712r1 May 2014 CIR Generation of 802.11ad Cluster grouping LOS path; Four first order (reflected) clusters from four walls; One first order cluster from ceiling; Four second order clusters from the walls and ceiling; Eight second order clusters corresponding to reflections from two walls. Ray Tracing Model for Conference Room 3 m 1st order reflection from ceiling Rx LOS Tx 1 m 3 m 2nd order reflection from walls 1 m 1st order reflection from wall 1 m 4.5 m Fig 2. 3D model of conference room used for ray tracing Submission Slide 6 Haiming Wang, et al. (SEU/CWPAN)
doc.: IEEE 802.11-14/0712r1 May 2014 CIR Generation of 802.11ad Clusters blockage probabilities of STA-STA scenario cfg.cr.Psta_1st_c = 0.9; Probability that the cluster is present for the 1st order reflections from ceiling cfg.cr.Psta_1st_w = 0.6; Probability that the cluster is present for the 1st order reflections from walls cfg.cr.Psta_2nd_wc = 0.7; Probability that the cluster is present for the 2nd order wall- ceiling (ceiling-wall) reflections cfg.cr.Psta_2nd_w = 0.2; Probability that the cluster is present for the 2nd order reflections from walls Submission Slide 7 Haiming Wang, et al. (SEU/CWPAN)
doc.: IEEE 802.11-14/0712r1 May 2014 CIR Generation of 802.11ad LOS path = toa A 0; = (0) /(4 ); d Cls.los_el=ap_el_los(N); tx_az = 0; tx_el = cls.los_el; rx_az = 0; rx_el = -cls.los_el; Function y = ap_el_los(size) Y = -76 + 45.*rand(1,size); Submission Slide 8 Haiming Wang, et al. (SEU/CWPAN)
doc.: IEEE 802.11-14/0712r1 May 2014 CIR Generation of 802.11ad Time of Arrival (Inter-cluster) Piecewise modeling of first order reflections from walls (green line) t 0 4 t 0.0577 - t 0.2307 + 4 7 = ( ) Wt t - 0.0307 t 0.3882 7 11 t + t - 0.0042 t 0.0958 11 23 t 0 23 Piecewise modeling of second order reflections from walls (blue line) 0 10 t . 0 08 10 20 t = ( ) Wt t t 30 . 0 02 20 30 t 0 Fig 3. TOA empirical distributions from ray tracing Submission Slide 9 Haiming Wang, et al. (SEU/CWPAN)
doc.: IEEE 802.11-14/0712r1 May 2014 CIR Generation of 802.11ad Reflection-loss (Inter-cluster) Without polarization: 1st order: normal distribution with 2nd order: normal distribution with = = ; = 10 16 ; 4 ; dB dB dB 5 dB = ; With polarization: Polarization matrix is introduced with coupling coefficients R(1,1)=ref_coef(0,1); R(2,2)=ref_coef(0,1); R(1,2)=0.1.*(2.*randn(1,1)>0-1); R(2,1)=0.1.*(2.*randn(1,1)>0-1); Submission Slide 10 Haiming Wang, et al. (SEU/CWPAN)
doc.: IEEE 802.11-14/0712r1 May 2014 CIR Generation of 802.11ad Reflection-loss (Inter-cluster) Reflection Loss for 1stOrder Reflection Mean value = -10 dB RMS = 4 dB Reflection Loss for 2ndOrder Reflection (total loss for two reflections) Mean value = -16 dB RMS = 5 dB Fig 4. Distribution of reflection losses Submission Slide 11 Haiming Wang, et al. (SEU/CWPAN)
doc.: IEEE 802.11-14/0712r1 May 2014 CIR Generation of 802.11ad Angular characteristics (Inter-cluster) Angular parameters of the four clusters are dependent upon each other. Trapezoidal area 1 Trapezoidal area 2 Fig 5. Joint distribution of azimuth angles Fig 6. Joint modeling of azimuth angles Submission Slide 12 Haiming Wang, et al. (SEU/CWPAN)
doc.: IEEE 802.11-14/0712r1 May 2014 CIR Generation of 802.11ad Ray modeling (Intra-cluster) The number of pre-cursor rays Nband post-cursor rays Nfwas derived from measurements; The average amplitudes Afand Abof the pre-cursor and post- cursor rays decay exponentially with decay times gf = 1.3 ns and gb= 1.3 ns , respectively; Pre-cursor rays are modeled as two Poisson processes with arrival rates f = 0.2 ns-1and b= 1.3 ns-1, respectively. Amplitude of pre-cursor rays and post-cursor rays was both modeled by Rayleigh distribution. Central ray Kf Kb Pre-cursor rays average power ~exp(| |/gf) Number of pre-cursor rays Nf Post-cursor rays average power ~exp(-| |/gb) Number of post-cursor rays Nb Post-cursor rays arrival rate b Pre-cursor rays arrival rate f time, = = 0 0 Fig 7. Time domain model of the cluster Submission Slide 13 Haiming Wang, et al. (SEU/CWPAN)
doc.: IEEE 802.11-14/0712r1 May 2014 CIR Generation of 802.11ad Amplitude modeling (Intra-cluster) The average amplitudes Afand Ab of the pre-cursor and post-cursor rays decay with decay times gf = 1.3 ns and gf= 1.3 ns , respectively. g / ( = ) ) 0 ( A A e f f f g / ( = ) ) 0 ( A A e b b b ( 0 , i ) = 20 log K 10 f ) 0 ( A f ( 0 , i ) = 20 log K 10 b ) 0 ( b A Fig 8. Experimental PDP of the cluster Submission Slide 14 Haiming Wang, et al. (SEU/CWPAN)
doc.: IEEE 802.11-14/0712r1 May 2014 Outline Review of generation of the channel impulse response of 11ad Realization process Modeling of parameters Statistical measurement at 45 GHz band Measurement process Modeling Future work Submission Slide 15 Haiming Wang, et al. (SEU/CWPAN)
doc.: IEEE 802.11-14/0712r1 May 2014 CIR Generation for TG11aj (45GHz) 11aj (45GHz) CIR New 11ad CIR gen. routine MIMO corr. mtx Parameters Submission Slide 16 Haiming Wang, et al. (SEU/CWPAN)
doc.: IEEE 802.11-14/0712r1 May 2014 Channel Measurement Scenario Fig 9. Living room environment Submission Slide 17 Haiming Wang, et al. (SEU/CWPAN)
doc.: IEEE 802.11-14/0712r1 May 2014 Parameters of Q-band Channel Measurement Parameter Value Frequency band 45 GHz (center 44.955 GHz) Method Signal Generator and VNA Sweep Frequency Subcarrier Spacing 2.578125 MHz Bandwidth 660 MHz Sweep Frequency Points 256 Sweep Frequency Duration 80 ms (adjustable) Tx Power 10 dBm Cable Length 2 m at both ends Antenna Horn antenna / Open ended waveguide antenna Measurement Scenario Conference room (Cubicle room, Living room) Submission Slide 18 Haiming Wang, et al. (SEU/CWPAN)
doc.: IEEE 802.11-14/0712r1 May 2014 Channel Measurement Technique Frequency domain measurement Complex response is recorded in the frequency domain; Channel impulse response is obtained from channel frequency response using 256 point IFFT transformation with hanning window to suppress sidelobe leakage. Scanning measurement in the angular domain Both transmit and receive antennas are rotated each 10 degree using horn antennas; 36 36 sub-channels are derived with detailed angular information; Clustering is campaigned in the joint angular and temporal domain. Submission Slide 19 Haiming Wang, et al. (SEU/CWPAN)
doc.: IEEE 802.11-14/0712r1 May 2014 Channel Impulse Response A ray is obvious in the left figure with corresponding propagation delay; Cluster decay rate and arrival rate are obtained from the right figure which combines all the sub-channel impulse responses; Clusters received after 100 ns are under the noise. Fig 10. Sub-channel impulse response Fig 11. Combined channel impulse response Submission Slide 20 Haiming Wang, et al. (SEU/CWPAN)
doc.: IEEE 802.11-14/0712r1 May 2014 Clustering in the angular domain Averaging is performed for received power in the frequency domain in each sub- channel to carry out clustering in the angular domain; Powers that are 30dB below the max received power are ignored to calculate number of rays that can be recognized by the receiver; Time of each sub-channel is derived from the CIR . Fig 12. Clustering in the angular domain Fig 13. Corresponding delay distribution Submission Slide 21 Haiming Wang, et al. (SEU/CWPAN)
doc.: IEEE 802.11-14/0712r1 May 2014 Clustering in the angular domain A clustering algorithm is used to classify all the rays to several clusters, and the best number of clusters is derived from a number range. Each color represents one cluster and the strongest ray component is signed. Number of clusters is uniformly distributed from 10 to 20; Fig 14. Clustering Submission Slide 22 Haiming Wang, et al. (SEU/CWPAN)
doc.: IEEE 802.11-14/0712r1 May 2014 Inter-cluster parameters Fig 15. CIR from IFFT of living room Fig 16. Clusters derived in angular domain Clusters that within 30 dB of the peak power are considered to be recognizable, and the power and the corresponding delay of received cluster are recorded and illustrated in the right picture which agree well with the CIR. Submission Slide 23 Haiming Wang, et al. (SEU/CWPAN)
doc.: IEEE 802.11-14/0712r1 May 2014 Inter-cluster parameters Clusters extracted from 10 measured locations are summarized and shown in the left picture. All clusters obeys a uniformly distribution with delay ranging from 0 ns to 70 ns and power ranging from 5 dB to peak power 30 dB. Fig 17. Distribution of cluster power in time domain Submission Slide 24 Haiming Wang, et al. (SEU/CWPAN)
doc.: IEEE 802.11-14/0712r1 May 2014 Clustering in the angular domain This figure presents exponentially decaying distribution of rays in one cluster which is extracted from the combination of CIR of all rays in the strongest cluster, and the main ray delay is set to be 0 ns as the reference delay. Fig 18. Power-delay distribution of rays Submission Slide 25 Haiming Wang, et al. (SEU/CWPAN)
doc.: IEEE 802.11-14/0712r1 May 2014 Clustering in the angular domain Fig 20. Distribution of azimuth AOA Fig 19. Distribution of azimuth AOD Submission Slide 26 Haiming Wang, et al. (SEU/CWPAN)
doc.: IEEE 802.11-14/0712r1 May 2014 Future Work Clustering will be improved to better classifying rays in the angular domain; Inter-cluster and intra-cluster parameters will be statically computed to describe the 45 GHz channel more accurately. We will put the new parameter list and some examples of channel generation of 11aj (45GHz) in our website in June 2014, and the hyperlink will be sent to the email reflector. More information of channel generation for 11aj (45 GHz) in conference room will be provided in this July session. Submission Slide 27 Haiming Wang, et al. (SEU/CWPAN)