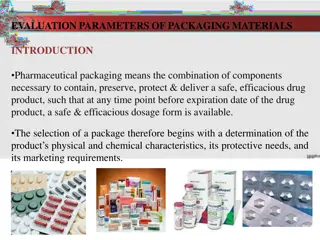
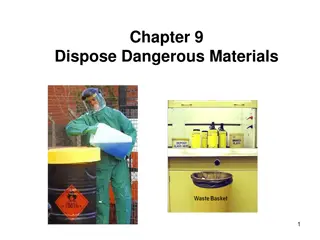
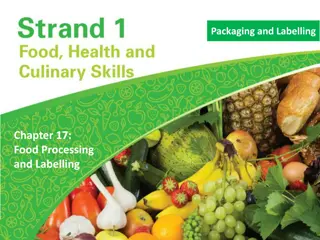
Impact of Packaging Wastes on Environment and Recycling Efforts
Packaging wastes, including glass, aluminum, steel, and paper containers, contribute significantly to solid waste generation. In 2015, millions of tons of packaging products were discarded, with varying recycling rates and disposal methods. Glass containers accounted for a substantial portion of waste, followed by aluminum and steel packaging. Efforts are being made to recycle and recover energy from these materials to reduce environmental impact.
- - Packaging Wastes
- - Recycling Efforts
- - Environmental Impact
- - Solid Waste Generation
- - Waste Disposal

Download Presentation

Please find below an Image/Link to download the presentation.
The content on the website is provided AS IS for your information and personal use only. It may not be sold, licensed, or shared on other websites without obtaining consent from the author. Download presentation by click this link. If you encounter any issues during the download, it is possible that the publisher has removed the file from their server.
E N D
Presentation Transcript
PACKAGING WASTES Waste Disposal and Pollution Abatement (DTE- 422) Dr. J. Badshah Head, Dairy Engineering, SGIDT, Patna (Bihar Animal Sciences University, Patna)
PACKAGING WASTES Containers and packaging as products that are assumed to be discarded the same year the products they contain are purchased. The majority of the solid wastes are packaging products, estimating to be about 77.9 million tons of generation in 2015 (29.7 percent of total generation). (US Environmental Protection Agency). The recycling rate in 2015 for containers and packaging was 53 percent. Furthermore, the process of burning of containers and packaging was 7.2 million tons (21.4 percent of total combustion with energy recovery). Following the landfills that received 29.4 million tons (21.4 percent of total land filling) within the same year.
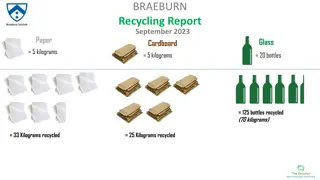
Types of packaging wastes Glass containers Bottles and jars for drinks and storing foods or juices It's been estimated by the EPA that 9.1 million tons of glass containers were generated in 2015, or 3.5 percent of municipal solid waste (MSW). About 70 percent of glass consumption is used for containers and packaging purposes. At least 13.2 percent of the production of glass and containers are burned with energy recovery. The amount of glass containers and packaging going into the land fill is about 53 percent.
Aluminum containers and packaging Aluminum container and packaging waste usually comes from cans from any kind of beverages,but foil can also be another that contributes it as well. It's been given that about 25 percent of aluminum is used for packaging purposes.Using the Aluminum Association Data,it has been calculated that at least 1.8 million tons of aluminum packaging were generated in 2015 or 0.8 percent MSW produced. Of those that are produced, only about 670,000 tons of aluminum containers and packaging were recycled, about 54.9 percent. And, the ones that ends up in the land fill is 50.6 percent.
Steel containers and packaging The production of steel containers and packaging mostly comes in cans and other things like steel barrels. Only about 5 percent of steel used for packaging purposes of the total world of steel consumption which makes it the least amount wasted and the most recycled. It's totaled that 2.2 million tons or 0.9 percent of MSW generated in 2015. While according to the Steel Recycling Institute, an estimate of 1.6 million tons (73 percent) of steel packaging were recycled. packaging that were combusted with energy recover was about 5.4 percent and 21.6 percent were land filled. Adding on, the steel
Paper and Paperboard Containers and Packaging The most of it being generated, and within the MSW in 2015, was corrugated boxes coming with at least 31.3 million tons (11.3 percent total) produced.However, it also the top most recycled at 28.9 million tons (92.3 percent) boxes being recycled in 2015. Later on, they are then combusted which makes 0.5 million tons and landfills received 1.9 million tons. Other than corrugated boxes, cartons, bags, sacks, wrapping papers, and other boxes used for shoes or cosmetics are other examples of paper and paperboard containers and packaging. The total amount of MSW generated for paper and paperboard containers and packaging was 39.9 million tons or 15.1 percent in 2015. Although, the recycled rate is about 78.2 percent and 4.3 percent of small proportions were combusted with energy recovery and 17.6 percent in landfill.
Plastic Containers and Packaging Plastic bottles, Supermarket bags, Milk and water jugs,and more. EPA used data from the American Chemistry Council to estimate that 14.7 million tons (5.5 percent of MSW generation) of plastic containers and packaging were created in 2015. The overall amount that is recycled is about 2.2 million tons (14.6 percent). In addition, 16.8 percent were combusted with energy recover and 68.6 percent went straight into the land fill. Most of the plastics are made from polyethylene terephthalate (PET), high-density polyethylene polyethylene (LDPE), (PVC),polystyrene (PS),polypropylene (PP) and other resins. (HDPE), low-density chloride polyvinyl That being said, the recycling rate for PET bottles and jars was 29.9 percent (890,000 tons) and the recycling of HDPE water and milk jugs was 30.3 percent (230,000 tons).[