Analysis of Suicide Trends in Southwest Health Planning Region (2003-2008)
This presentation explores data on suicide rates in the Southwest Health Planning Region from 2003 to 2008. It covers the average number of suicides per year, the demographics of suicide victims, the methods used in suicides, and a comparison with homicide rates. The visuals depict the number of suicides and non-fatal attempts over the years, providing insights into the prevailing mental health challenges in the region.

Download Presentation

Please find below an Image/Link to download the presentation.
The content on the website is provided AS IS for your information and personal use only. It may not be sold, licensed, or shared on other websites without obtaining consent from the author. Download presentation by click this link. If you encounter any issues during the download, it is possible that the publisher has removed the file from their server.
E N D
Presentation Transcript
Suicide in the Southwest Health Planning Region, 2003-2008 Marc E. Leslie Coordinator, Virginia Violent Death Reporting System Office of the Chief Medical Examiner, Virginia Department of Health The Southwest Health Planning Region Suicide Prevention Summits May 10, 2011 Abingdon, VA May 11, 2011 Roanoke, VA
Map of the Southwest Health Planning Region (HPR) Alleghany Covington Amherst Botetourt Craig Lynchburg Appomattox Bedford City Giles Montgomery Radford Salem Roanoke City Campbell Buchanan Bedford Roanoke Bland Tazewell Dickenson Wise Pulaski Franklin Floyd Russell Norton Wythe Pittsylvania Smyth Carroll Washington Bristol Martinsville Scott Patrick Galax Lee Grayson Henry Danville 2
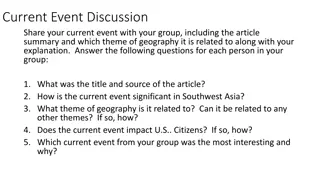
Pop Quiz In the Southwest Health Planning Region: 1. Average number of suicides per year? (Hint: average of 60 homicides per year). 2. Percentage of suicide victims who are White males? 3. Median age of a suicide victim? 4. Percentage of male and female suicides by firearm? 3
Suicide in the Southwest HPR, 2003-2008 Overview of the Problem 4
Suicide in the Southwest HPR, 2003-2008 Number of Suicides by Year 240 231 230 Number of Suicides 218 220 214 211 210 202 201 197 200 190 180 Average 2003 2004 2005 2006 2007 2008 Year 5
Suicide in the Southwest HPR, 2003-2008 Suicide Rate by Year 20.0 17.6 16.4 16.2 18.0 16.0 15.4 15.3 15.1 Suicide Rate Per 100,000 16.0 14.0 12.0 12.0 10.0 11.4 11.3 11.3 11.2 11.0 10.8 8.0 6.0 4.0 2.0 0.0 Total 2003 2004 2005 2006 2007 2008 Year Southwest HPR Virginia 6
Suicide in the Southwest HPR, 2003-2008 Suicide vs. Homicide (2003-2008) 1,263 suicides; rate of 16.0 357 homicides; rate of 4.5 Suicide occurs 3.6 times more often than homicide 7
Suicide in the Southwest HPR, 2003-2008 Number of Non-Fatal Suicide Attempts by Year 1250 1,208 1,184 1200 Number of Suicides 1150 1,094 1100 1,072 1,045 1,044 1050 1,011 1000 950 900 Average 2003 2004 2005 2006 2007 2008 Year 8
Suicide in the Southwest HPR, 2003-2008 Non-Fatal Suicide Attempt Rate by Year 100.0 Non-Fatal Suicide Rate Per 100,000 91.0 89.4 83.1 81.6 90.0 79.8 79.3 77.3 80.0 70.0 69.2 60.0 66.4 62.3 61.1 60.0 50.0 59.0 58.2 40.0 30.0 20.0 10.0 0.0 Total 2003 2004 2005 2006 2007 2008 Year Southwest HPR Virginia 9
Suicide in the Southwest HPR, 2003-2008 Who is at Risk? 10
Suicide in the Southwest HPR, 2003-2008 Selected Demographic Elements Gender Race Age 11
Suicide in the Southwest HPR, 2003-2008 Race and Gender Male (81%, rate of 26.6) White (94%, rate of 17.4) White male (76%, rate of 28.7) (remember, overall rate for Southwest HPR is 16.0) 12
Suicide in the Southwest HPR, 2003-2008 Age Median age is 46 Ages 35-44 most common age group (20%) and highest rate (23.7) Next highest rates for those 75-84 (rate of 22.2) and 45-54 (rate of 21.8) 13
Suicide in the Southwest HPR, 2003-2008 Suicide Rate by Age Group 25.0 Suicide Rate Per 100,000 20.0 15.0 10.0 5.0 0.0 Age Group Southwest HPR Virginia 14
Suicide in the Southwest HPR, 2003-2008 Race and Gender: Non-Fatal Attempts Most commonly by females (59%, rate of 96.1) Whites still most common and highest risk; but Black risk level rises notably (from rate of 7.3 to 57.5) 15
Suicide in the Southwest HPR, 2003-2008 Fatal and Non-Fatal Suicide Rates by Gender 120.0 100.0 Rate Per 100,000 80.0 60.0 96.1 83.1 40.0 69.3 20.0 26.6 16.0 5.9 Female 0.0 Total Male Gender Fatal Non-Fatal 16
Suicide in the Southwest HPR, 2003-2008 Age: Non-Fatal Attempts Median age is 35 Risk increases greatly for most age groups, especially those under age 64 15 times increase for those ages 15-19 Rate for those 35-44 years old is 163.4 In general, non-fatal attempt rate decreases with age 17
Suicide in the Southwest HPR, 2003-2008 Non-Fatal and Fatal Suicide Rate by Age Group 180.0 160.0 140.0 Rate Per 100,000 120.0 At ages 65-74, the fatal rate surpasses the non-fatal rate 100.0 80.0 60.0 40.0 20.0 0.0 Age Group Non-Fatal Fatal 18
Suicide in the Southwest HPR, 2003-2008 Veterans 19
Suicide in the Southwest HPR, 2003-2008 Veterans 22% of all suicide victims (18 years and older) 22% of males; <1% of all females Unknown if veterans served in combat, but can generally tell if they are currently in the military 20
Suicide in the Southwest HPR, 2003-2008 Veterans Male veterans older than male non-veterans (median ages of 62 and 43, respectively) Median age suggests that those who are combat veterans generally not in the most recent conflicts 58% of males ages 65 and over are veterans compared to 19% of males ages 18-64 21
Suicide in the Southwest HPR, 2003-2008 Method of Fatal Injury 22
Suicide in the Southwest HPR, 2003-2008 Method of Fatal Injury More than one method of fatal injury can be used per suicide (e.g., combining poison and drowning) Firearm, poison, and hanging/suffocation account for 96% of suicides Most poisons are prescribed medications, primarily mental health medications and pain medications 23
Suicide in the Southwest HPR, 2003-2008 Selected Methods by Gender 100.0 90.0 14.4 12.0 13.9 Percentage Using Method 80.0 10.1 15.1 70.0 36.5 60.0 Hanging/Suffocation Poison Firearm 50.0 40.0 71.7 66.9 30.0 46.5 20.0 10.0 0.0 Total Males Females Gender 24
Suicide in the Southwest HPR, 2003-2008 Method of Fatal Injury: Non-Fatal Attempts Most common method for non-fatal attempts is poison (85%) Poison use is defining method difference between fatal and non-fatal attempts 25
Suicide in the Southwest HPR, 2003-2008 Geography 26
Suicide in the Southwest HPR, 2003-2008 Geography Southwest HPR has 40 localities (29 counties and 11 cities) 36 of these localities (90%) have a suicide rate exceeding the rate for Virginia (11.3) In general smaller locality = lower number and higher rate 27
Suicide in the Southwest HPR, 2003-2008 # Rate # Rate Five Highest Suicide Rates Five Lowest Suicide Rates Grayson 24 24.6 Radford 9 9.9 Buchanan 36 24.4 Lynchburg 42 10.3 Lee 34 24.0 Bedford City 4 10.6 Patrick 26 22.7 Bedford County 44 11.2 Craig 7 22.7 Floyd 10 11.4 28
Suicide in the Southwest HPR, 2003-2008 Rate per 100,000 Alleghany Covington 10 - 13 Amherst 14 - 17 Botetourt 18 - 21 Craig Lynchburg Appomattox 22 - 25 Bedford City Giles Salem Roanoke City Campbell Montgomery Buchanan Roanoke Bedford Radford Bland Tazewell Dickenson Wise Pulaski Franklin Floyd Russell Norton Wythe Pittsylvania Smyth Carroll Washington Bristol Martinsville Scott Patrick Galax Lee Grayson Henry Danville 29
Suicide in the Southwest HPR, 2003-2008 Alleghany Covington Rate per 100,000 Amherst Botetourt 9.9 - 11.3 Craig Lynchburg Appomattox Bedford City 11.4 - 24.6 Salem Giles Roanoke City Buchanan Campbell Montgomery Radford Bedford Roanoke Bland Tazewell Dickenson Wise Franklin Pulaski Floyd Russell Wythe Norton Pittsylvania Smyth Washington Carroll Patrick Martinsville Scott Galax Lee Grayson Henry Danville Bristol 30
Suicide in the Southwest HPR, 2003-2008 Selected Circumstances 31
Suicide in the Southwest HPR, 2003-2008 Most Common Circumstances Mental health problem (44%) Crisis in past two weeks (42%) Intimate partner problem (33%) Problem with alcohol and/or other substances (23%) Physical health problem (23%) 32
Suicide in the Southwest HPR, 2003-2008 Circumstances: Mental Health Females (62%) more than males (40%) Most prevalent in ages 45-54 (50%); 20% or more of every age group 78% treated in past two months and/or prior 56% known to take mental health medications currently or in the past* *2007-2008 data 33
Suicide in the Southwest HPR, 2003-2008 Circumstances: Crisis in Past 2 Weeks 42% of all persons; 43% of males, 39% of females Most crises (63%) occurred in the past 24 hours* Indicator of reactive suicides 50% or more for every age group through ages 25-34 *2007-2008 data 34
Suicide in the Southwest HPR, 2003-2008 Circumstances: Intimate Partner Problems 33% having problems with current/former intimate partner at time of suicide Similar for males and females 76% also having a recent life crisis Shows volatility of intimate partner conflict 35
Suicide in the Southwest HPR, 2003-2008 Intimate Partner Problems and Crisis by Age Group 100.0 Percentage with Circumstance 90.0 80.0 70.0 60.0 50.0 40.0 30.0 20.0 10.0 0.0 Age Group Intimate Partner Problem Crisis in Past 2 Weeks 36
Suicide in the Southwest HPR, 2003-2008 Circumstances: Alcohol and Other Substance Problems 23% of all persons Peaks at ages 25-34 (36%) 61% of those with alcohol problems had elevated levels of alcohol in their system (compared to 14% of those without alcohol problems) 37
Suicide in the Southwest HPR, 2003-2008 Circumstances: Physical Health Problems 23% of all suicide victims; 23% of males, 20% of females Median age of 64 compared to 43 for those without a physical health problem 50% or more of those age 65 and older 38
Suicide in the Southwest HPR, 2003-2008 Circumstances: Physical Health Problems Explains majority of elder suicides Problems range from treatable (diabetes, mild pain) to severe (loss of vision, amputations) to terminal diseases and conditions 39
Suicide in the Southwest HPR, 2003-2008 Circumstances: Warning Signs 43% disclosed intent and/or had prior attempts Most commonly disclosed to family (49%), intimate partners (37%), or friends/acquaintances (16%)* *2007-2008 data 40
Suicide in the Southwest HPR, 2007-2008 Actions Taken to Prevent Suicide* Limited access to firearms/ammunition (42%) Tried to persuade victim to not commit suicide (33%) Called 911/law enforcement (17%) Sought/encouraged mental health treatment (13%) Checked in on victim (4%) *2007-2008 data (entire slide) 41
Suicide in the Southwest HPR, 2007-2008 Efforts to Limit Access to Firearms and/or Ammunition* 13 persons had friends or family members who restricted access to firearms or ammunition Includes 3 persons not known to disclose intent, but loved ones acted out of concern Variety of techniques used to restrict (hiding, removing, disassembling) Of these persons, 11 (85%) used a firearm to commit suicide *2007-2008 data (entire slide) 42
Suicide in the Southwest HPR, 2003-2008 In the fatal suicide, those with prior attempts used less lethal methods than those without prior attempts No Prior Suicide Attempts Prior Suicide Attempts Other 3% Other 7% Hanging/ Suffocation 12% Hanging/ Suffocation 25% Poison 13% Firearm 39% Firearm 72% Poison 29% 43
Suicide in the Southwest HPR, 2007-2008 Other Warning Signs of Suicide* Taking prescribed pain medication (11%) Sleeping too little (4%) Unusual behavior, past two weeks (4%) Family history of suicide (3%) Family/friends expected suicide (1%) *2007-2008 data (entire slide) 44
Suicide in the Southwest HPR, 2003-2008 Conclusions Suicide rates are highest among Whites, males, and middle-aged adults Most suicides involve use of a firearm to inflict fatal injury A large proportion of suicide victims have a mental health problem, and most of these persons were being treated 45
Suicide in the Southwest HPR, 2003-2008 Conclusions 43% of suicide victims talk about plans or desire to commit suicide and/or have a history of suicide attempt(s) Fatal suicide and non-fatal suicide attempts present different pictures of risk and methods of fatal injury 46
Questions, Data Requests, Further Information Marc Leslie, VVDRS Coordinator 737 N. 5th Street, Suite 301 Richmond, VA 23219 804-205-3855 marc.leslie@vdh.virginia.gov http://www.vdh.virginia.gov/medExam/NVDRS.htm Our goal is to provide data and information that can be used for prevention and education; please let me know how I can help 47
Appendix: Additional Information and Complete Tables 48
Suicide in the Southwest HPR, 2003-2008 Index: Fatal Suicide Information Slide Information Slide Demographics Gender Race Ethnicity Race/Gender Age Group Veterans Male Age Group/Veteran Method of Fatal Injury Complete List of Methods Selected Methods by Age Categories of Poison Most Common Poisons Locality-Specific Number/Rate by Locality Circumstances Relationship Problems Life Stressors Alcohol/Other Substances Mental Health Warning Signs of Suicide Disclosed Intent Actions to Prevent Suicide Prior Suicide Attempts Other Warning Signs 51 51 51 52 53 62-65 66 66 67 68-69 56 70 71 57 58 59 60 72-73 74 75 49
Suicide in the Southwest HPR, 2003-2008 Index: Non-Fatal Suicide Information Slide Non-Fatal Suicide Gender Race Ethnicity Age Group Method of Fatal Injury Complete List of Methods 54 54 54 55 61 50

")