Understanding Consumer Choice and Utility Theory

Explore the concepts of consumer choice, utility, and revealed preference in economics. Learn how utility functions help us rank the desirability of consuming different bundles of goods. Discover the mathematical representation of utility and see examples of representing utility in terms of goods consumption.

Download Presentation

Please find below an Image/Link to download the presentation.
The content on the website is provided AS IS for your information and personal use only. It may not be sold, licensed, or shared on other websites without obtaining consent from the author. Download presentation by click this link. If you encounter any issues during the download, it is possible that the publisher has removed the file from their server.
E N D
Presentation Transcript
Consumer Choice, Utility, and Revealed Preference 1
Agenda Consumer Utility Consumer Choice Revealed Preference 2
Consumer Theory There are two important pillars that consumer theory rests upon: The utility function The budget constraint 3
Utility Function A utility function is a function/process that maps a bundle of goods into satisfaction where the satisfaction can be ranked for each bundle of goods. In essence, it allows us to rank the desirability of consuming different bundles of goods. A bundle of goods is a particular set of goods you choose to consume. This is also referred to as a consumption bundle. 4
Mathematically Representing Utility In Economics, we tend to define the utility function as the following: U = u(x1, x2, , xn) where U is the level of satisfaction you receive from consuming the bundle of goods consisting of x1, x2, , xn u( ) is the function that maps the bundle of goods into satisfaction. (Think of this as the mathematical representation of your brain.) xifor i = 1, 2, , n is the quantity of a particular good consumed from a bundle of goods, e.g., x1 may be 5 pancakes. 5
Example of Representing Utility in Mathematical Terms Suppose you have a utility function that is based on three goods pizza, soda, and buffalo wings. We can represent your utility function as U = u(x1, x2, x3). x1 = amount of pizza consumed x2 = amount of soda consumed xn = x3 = amount of buffalo wings consumed 6
Example of Representing Utility in Mathematical Terms Suppose you have a choice of consuming one of two different bundles of goods. Bundle 1 has a large pepperoni pizza, a two liter bottle of coke, and 20 spicy buffalo wings. Bundle 2 has a large pepperoni pizza, a two liter bottle of coke, and 40 spicy buffalo wings. 7
Example of Representing Utility Cont. For bundle 1 x1 = a large pepperoni pizza x2 = a two liter bottle of coke xn = x3 = 20 spicy buffalo wings For bundle 2 x1 = a large pepperoni pizza x2 = a two liter bottle of coke xn = x3 = 40 spicy buffalo wings 8
Example of Representing Utility Cont. We can further write the following: U1 = u(a large pepperoni pizza, a two liter bottle of coke, 20 spicy buffalo wings) U2 = u(a large pepperoni pizza, a two liter bottle of coke, 40 spicy buffalo wings) Remember u( ) is just a function that transforms bundles of goods into satisfaction. (Think of it as your brain.) What might be inclined to say that U2 > U1. Why? 9
Some Notes on Utility It was once thought that utility could be broken down into units called utils. Total utility is defined as the utility you receive from consuming a particular bundle of goods. For analytical tractability, total utility can be given a number value. In our previous example we could say that U1 = 100 and U2 = 200. 10
Some Notes on Utility Cont. There are two views of utility: Cardinal Utility Cardinal utility is the belief that utility can be measured and compared on a unit by unit basis. E.g., A utility measure of 200 is twice as big as a utility measure of 100. Ordinal Utility Ordinal utility is where you rank bundles of goods, but cannot say how much greater one bundle is to another. Ranking is the only thing that matters when dealing with ordinal utility. 11
Utility from Consuming One Good When examining utility, we sometimes would like to examine how one good affects our utility. This can be looked at by assuming that we have only one good in our utility function, i.e., U=u(x). A more realistic outlook is that we examine only one good in our utility function, holding all the other goods constant. 12
Utility from Consuming One Good Cont. Mathematically, we can represent holding things constant in the following two manners for one good: U = u(x1; x2, x3, , xn) or U = u(x1 | x2 ,x3, , xn) Where it is understood using this notation that goods x2 through xn are held at some constant level. 13
Marginal Utility (MU) Marginal utility is defined as the change in total utility divided by a change in the consumption of a particular good. In mathematical terms, marginal utility of good i is defined as du(x)/dx, which is just the first derivative of the utility function with respect to good x. 14
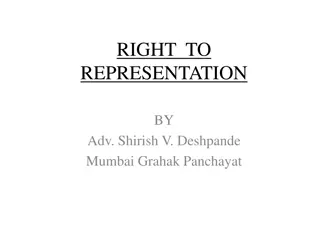
Calculating Marginal Utility Suppose Dr. Hurley only like to consume chocolate. Also, assume that Dr. Hurley s total utility function can be represented as U(x) = 10x-x2 This implies that MU(x)=du/dx= 10 - 2x Assuming that chocolates were free, how many chocolates would Dr. Hurley consume? 15
Total Utility and marginal Utility of U(x)=10x-x2 Utility and Marginal Utility 30 25 20 15 U(x) MU(x) 10 Utils 5 0 -5 0 2 4 6 8 10 12 -10 -15 Number of Goods 16
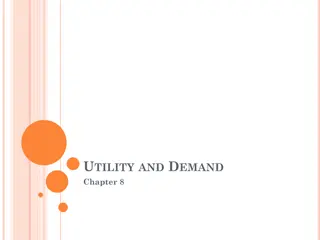
Deriving Total and Marginal Utility from a Function Suppose you could represent your utility function for drinking Mountain Dew as the following: U = u(x) Where u(x) = 10x What is Total Utility and Marginal Utility? Graph both. 17
Total Utility and marginal Utility of U(x)=10x Utility and Marginal Utility 60 50 40 U(x) MU(x) Utils 30 20 10 0 0 5 10 15 20 25 Number of Goods 18
Lessons Learned from Example As long as marginal utility is positive, total utility will increase. Total and marginal utility can be negative. When marginal utility is zero, total utility is maximized. This graph demonstrated the Law of Diminishing Marginal Utility. 19
Law of Diminishing Marginal Utility This law states that as you consume more units or a particular good during a set time, at some point your marginal utility will decrease as your consumption increases. Note: Beware of laws in economics, they are not like physical laws. This is equivalent to saying that the derivative of MU is negative. 20
Utility from Consuming Two Goods When examining utility, we sometimes would like to examine how two good interrelate in our utility function. This can be looked at by assuming that we have only one good in our utility function, i.e., U=u(x1, x2). A more realistic outlook is that we examine two goods in our utility function, holding all the other goods constant. 21
Utility from Consuming Two Goods Cont. Mathematically, we can represent holding things constant in the following two manners for two goods: U = u(x1, x2; x3, , xn) or U = u(x1,x2 |x3, , xn) Where it is understood using this notation that goods x3 through xn are held at some constant level. 22
Isoutility To this point we have examined utility based on the consumption of one good. Realistically, our consumption bundles have more than one item in them. When more than one good exist in our consumption bundle and utility function, it becomes important for us to examine the idea of isoutility. 23
Isoutility Isoutility is a concept where differing bundles of goods provide the same level of utility. From the idea of isoutility comes the graphical representation--an indifference curve. An indifference curve is the graphical representation of differing bundles of goods giving the same level of utility. 24
Demonstrating an Indifference Curve Suppose we have two goods in our utility function corn dogs (C) and sandwiches (S). To obtain an indifference curve, we want to hold our utility constant and look at the different bundles of consumption of each good that provide the same utility. Suppose we know that we have the following utility function U = u(C, S) = C*S 25
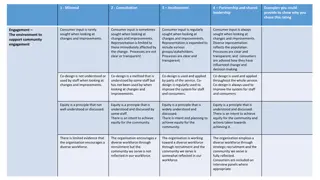
Demonstrating an Indifference Curve Cont. To derive the indifference curve, we want to keep U constant. In this case we will assume U = 10 What bundles of goods will give us this level of satisfaction? What if U = 20? 26
Increasing Utility 27
Observations The two utility curves do not cross each other. Why? Utility is increasing as you move away from the x and y-axis. As you consume more of one of the goods, the consumption of the other good has relatively more value to you. Any other observations? 28
Notes on Indifference Curves Indifference curves usually are not considered thick. Why. Indifference curves tend to not be upward sloping. Why? 29
Example of a Thick Indifference Curve x2 10 6 x1 7 30
Marginal Rate of Substitution (MRS) When examining indifference curves, it is important to look at the tradeoff between consuming one good versus the other. This is called examining the marginal rate of substitution. The marginal rate of substitution can be defined as the rate at which the consumer is willing to trade one good for another. Why is this important to examine? 31
Mathematical Representation of MRS MRS of good xi for good xj =dxj /dxi 32
Example of Calculating MRS From our previous example, we had the following utility function: U = u(C,S) = C*S Setting U = 10, what is the MRS of corndogs for sandwiches at 2 sandwiches and 5 corndogs, i.e., dS /dC? 33
Implication of Indifference Curve Due to indifference curves, we have the following relationship for differing bundles of goods: (dxj / dxi) = -(MUxi /MUxj) Which implies (dxj * MUxj) = -(MUxi * dxi) Which implies (dxj * MUxj) + (MUxi * dxi) = 0 This implies that the loss in utility from consuming less of good xj is just matched by the gain in utility from consuming more of xi. 34
Budget Constraint This constraint defines the feasible set of consumption bundles you are able to consume. It is dependent on three things: The prices of the goods in your consumption bundle. The quantity of each good in your consumption bundle. Your income. 35
Budget Constraint Cont. The budget constraint for two goods is defined as the following: m = p1*x1 + p2 * x2 m = income p1 = the price of x1 p2 = the price of x2 x1 = the quantity consumed of good 1 x2 = the quantity consumed of good 2 36
Budget Constraint Cont. Assume that we want to graph are budget constraint and choose x2 as the good we want to put on the y-axis. m = p1*x1 + p2 * x2 can be rewritten as: x2 = (m/p2) (p1/p2) * x1 With this equation we can draw the budget constraint on a graph. Note that the slope of the budget constraint is equal to the negative of the price of good 1 divided by the price of good 2. 37
Budget Constraint Example Suppose you have $100 to spend on chips and soda. You know that the price of chips is $1 and the price of soda is $2. Draw your budget curve assuming that chips will be on the y- axis. 38
Budget Constraint Example Budget equation: $100 = $2 *x1 + $1 *x2 x2 = 100 2*x1 39
Budget Constraint Cont. # of Chips 100 x2 = 100 2*x1 Not Feasible Feasible Set 50 # of Sodas 40
Consumer Equilibrium Consumer equilibrium is comprised of two concepts: The utility function The budget constraint Consumer equilibrium can be defined as a consumption bundle that is feasible given a particular budget constraint and maximizes total utility. 41
Consumer Equilibrium Cont. If there was no budget constraint, a person would consume each good to the point where marginal utility of consumption for each good is zero. Why? Given a budget constraint, the consumer maximizes total utility by consuming a bundle that is feasible. A feasible bundle is one that lies either on or inside the budget constraint. 42
Consumer Equilibrium Cont. In graphical terms, consumer equilibrium is defined as the point where the highest utility function touches the budget constraint. 43
General Utility Maximization Model ( , ,..., ) Max ,..., , 2 1 u x x x 1 2 n x subject to x x n : n = i m p x i i 1 44
Utility Maximization with One Good ) ( x u Max x subject to x : m px = u + ( x , ) ( ) ( ) u x m px = = 0 p x u MU x = = p p = 0 m px 45
Utility Maximization with One Good Cont. When your maximizing utility with respect to one good, there are two scenarios that occur: You have more money than you need to maximize your utility, so you do not spend all of your money. This implies = 0 and m > px. You run out of money before you reach the highest amount of utility you can achieve. This implies > 0 and m = px. To solve this problem, you need to check which scenario provides the highest utility while satisfying the constraint. 46
Consumer Equilibrium Example for One Good Suppose we have the following utility function: U = u(x) = x Suppose the price of good x is $5 and the income available is $125. What is the optimal utility and how much money do you have left? 47
Consumer Equilibrium Example for One Good Cont. Now, Suppose we have the following utility function: U = u(x) = 10x-x2 Suppose the price of good x is $5 and the income available is $125. What is the optimal utility and how much money do you have left? 48
Utility Maximization for Two Goods Suppose we have the following utility function: U = u(x1,x2) Where x1 is equal to the number of good 1 Where x2 is equal to the number of good 2 Suppose we have the following budget constraint: M = p1*x1 + p2*x2 Where p1 is equal to the price of good 1 Where p1 is equal to the price of good 2 49
Utility Maximization with Two Goods Cont. ( , ) Max x u x x 1 2 , x 1 2 = + subject to : m p x p x 1 1 2 2 50


")