Understanding Financial Bubbles: Symptoms, Phases, and Historical Examples
Financial bubbles occur when asset prices far exceed their intrinsic value, leading to market distortions and eventual crashes. This article explores the definition, symptoms, phases, and historical examples of financial bubbles, such as the Dutch Tulip Mania in the 1600s and the Tech Bubble of 2000.

Download Presentation

Please find below an Image/Link to download the presentation.
The content on the website is provided AS IS for your information and personal use only. It may not be sold, licensed, or shared on other websites without obtaining consent from the author. Download presentation by click this link. If you encounter any issues during the download, it is possible that the publisher has removed the file from their server.
E N D
Presentation Transcript
Financial Bubble Jerry Odogwu 443748
Definition The term bubble, in the financial context, generally refers to a situation where the price for an asset exceeds its fundamental value by a large margin. During a bubble, prices for a financial asset or asset class are highly inflated, bearing little relation to the intrinsic value of the asset. (Investopedia S., 2010). It may also be referred to as financial or speculative or asset price bubble.
Symptoms/Characteristics Extremely strong demand of the asset in question (usually caused by change government policy or law, technology or nature) Little or no correlation between price and intrinsic value of asset Excess money in circulation Failure to recognize that regular market participants and other forms of traders are engaged in a speculative exercise, which is not supported by previous valuation techniques. (Patton M., 2015)
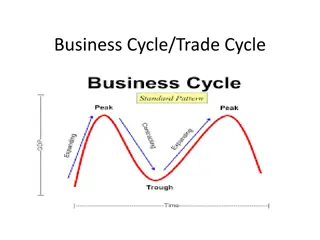
Phases of a Financial Bubble Displacement investors get enamored by a new paradigm Boom Prices rise slowly at first, but then gain momentum as more and more participants enter the market Euphoria caution is thrown to the wind, as asset prices skyrocket. Valuations reach extreme levels during this phase. Profit Taking the smart money heeding the warning signs is generally selling out positions and taking profits. Panic asset prices reverse course and descend as rapidly as they had ascended. Investors and speculators now want to liquidate at any price
First Recorded Bubble: The Dutch Tulip Mania (1600s) This bubble occurred between late 1636 and mid 1637. Tulips came out of nowhere, having been imported from Turkey. Supply was low because of the 7-year growth cycle and further collapsed due to a virus. Thus, demand spiked and Tulips became so popular that their prices soared, some bulbs cost 10 times more than the annual wage of a skilled worker. The crash of the tulip market started when no one showed up for a routine bulb auction in Haarlem. Within days, the panic had spread across the country. Despite the efforts of traders to prop up demand, the market for tulips evaporated. Flowers that had commanded 5,000 guilders a few weeks before now fetched one-hundredth that amount. (Weisenthal, J. 2011)
First Recorded Bubble: The Dutch Tulip Mania (1600s) Tulip Price Index
Anatomy of a Bubble: The Tech Bubble (aka Dot- Com Bubble) of 2000 This was a period of time where the price of technology stocks soared. These companies where mostly funded by venture capitalists, offered free services and where expected to monetize some time in the future; forcing the demand and prices of their stocks to skyrocket. But on the flip side, most of these companies had their books in red.
Anatomy of a Bubble: The Tech Bubble (aka Dot- Com Bubble) of 2000 Phase I: smart money invests Phase II: institutional investors get into the game; bubble begins to form Phase III: general public begins to notice and starts to invest Phase IV: prices rise the steepest because everyone now knows about the amazing investment. Biggest losers are those that invest in this phase. Point A: false bottom point, which gives the impression that prices are about to rebound The chart above represents the NASDAQ Composite which is an index of nearly 4,000 companies, almost two-thirds of which are technology companies. It covers the period of time from January 1, 1994 to October 9, 2002. Point B: bear trap that gives the impression of a rebounding market.
Other Significant Bubbles in History The South Sea Bubble Japan s Real Estate and Stock Market Bubble The US Housing Bubble
Protecting Our Investments Diversification of investments Avoiding popular investment opportunities Gathering proper financial and managerial knowledge and information about companies before committing funds. Seeking professional opinions that are backed up by data, research and experience. Using standard stock valuation techniques to determine the real value of stocks Fundamental Analysis (Price-Earning Method, Dividend Discount Model and Free Cash Flow model) Technical Analysis. (Madura J. 2009)
References Investopedia, S. (2010) Five steps of A bubble. Available at: http://www.forbes.com/2010/06/17/guide-financial-bubbles-personal-finance-bubble.html (Accessed: 13 October 2016). Patton, M. (2015) The coming financial bubble: Why it may be the worst of all - part I. Available at: http://www.forbes.com/sites/mikepatton/2015/02/24/the-coming-financial-bubble-why-it-may- be-the-worst-of-all/#1edcf3775075 (Accessed: 13 October 2016). Picardo, E. (2015) Five of the largest asset bubbles in history , in Available at: http://www.investopedia.com/articles/personal-finance/062315/five-largest-asset-bubbles- history.asp (Accessed: 13 October 2016). Weisenthal, J. (2011) The most amazing bubbles in human history. Available at: http://www.businessinsider.com/the-biggest-bubbles-of-all-time-2010-5#the-dutch-tulip-bubble- 1 (Accessed: 13 October 2016). Madura, J. and Madura, P.J. (2009) Financial markets and institutions (with stock Trak coupon). 9th edn. United States: South Western Educational Publishing