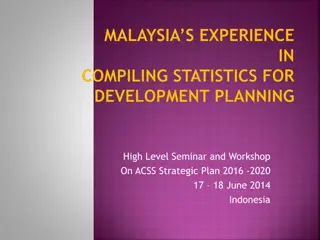
Kidney Replacement Therapy Incidence Trends in Malaysia

The data presented in this study outlines the stock and flow of new Kidney Replacement Therapy (KRT) patients in Malaysia from 2012 to 2022. It covers the incidence rates of new dialysis patients, hemodialysis (HD) patients, peritoneal dialysis (PD) patients, and transplant patients. The figures and tables illustrate the changes in KRT modalities over the years, providing insights into the kidney replacement landscape in Malaysia.

Download Presentation

Please find below an Image/Link to download the presentation.
The content on the website is provided AS IS for your information and personal use only. It may not be sold, licensed, or shared on other websites without obtaining consent from the author. Download presentation by click this link. If you encounter any issues during the download, it is possible that the publisher has removed the file from their server.
E N D
Presentation Transcript
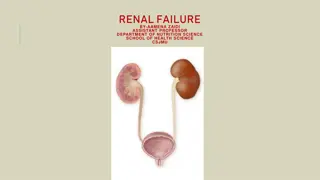
CHAPTER 1 ALL KIDNEY REPLACEMENT THERAPY IN MALAYSIA Sunita Bavanandan Hooi Lai Seong Ong Loke Meng Choo Cheh Loo
Table 1.1.1: Stock and flow of New KRT Incidence, Malaysia Table 1.1.1: Stock and flow of New KRT Incidence, Malaysia 2012 2012- -2022 2022 Year New Dialysis Patients New HD Patients New PD Patients New Transplant Patients New Dialysis Rate, pmp New HD Rate, pmp New PD Rate, pmp New Transplant Rate, pmp New HD, % New PD, % New Tx, % 2022 9592 7768 1824 212 293 238 56 6 79.2 18.6 2.2 2021 9352 7668 1684 80 285 234 51 2 81.3 17.9 0.8 2020 9465 7901 1564 153 292 244 48 5 82.1 16.3 1.6 2019 9496 8062 1434 159 297 252 45 5 83.5 14.9 1.6 2018 8552 7323 1229 98 271 232 39 3 84.7 14.2 1.1 2017 8089 6956 1133 112 260 224 36 4 84.8 13.8 1.4 2016 8111 7104 1007 89 264 232 33 3 86.6 12.3 1.1 2015 8046 6909 1137 114 266 228 38 4 84.7 13.9 1.4 2014 7628 6631 997 91 255 222 33 3 85.9 12.9 1.2 2013 7000 6216 784 100 238 211 27 3 87.5 11 1.4 2012 6698 5937 761 108 230 204 26 4 87.2 11.2 1.6
Figure 1.1.1(a): Number of new KRT patients by modality (New Figure 1.1.1(a): Number of new KRT patients by modality (New Dialysis and New Transplant), Malaysia 1969 Dialysis and New Transplant), Malaysia 1969- -2022 2022 10,000 9,500 9,000 8,500 8,000 7,500 7,000 No. of patients 6,500 6,000 5,500 5,000 4,500 4,000 3,500 3,000 2,500 2,000 1,500 1,000 500 0 1969 1971 1973 1975 1977 1979 1981 1983 1985 1987 1989 1991 1993 1995 1997 1999 2001 2003 2005 2007 2009 2011 2013 2015 2017 2019 2021 1970 1972 1974 1976 1978 1980 1982 1984 1986 1988 1990 1992 1994 1996 1998 2000 2002 2004 2006 2008 2010 2012 2014 2016 2018 2020 2022 HD PD TX (For actual numbers in Fig 1.1.1, refer to Appendix T1.1.1)
Figure 1.1.1(b): Proportion of new KRT patients by modality Figure 1.1.1(b): Proportion of new KRT patients by modality (New Dialysis and New Transplant), Malaysia 1969 (New Dialysis and New Transplant), Malaysia 1969- -2022 2022 100 95 90 85 80 Porportion of patients (%) 75 70 65 60 55 50 45 40 35 30 25 20 15 10 5 0 1969 1971 1973 1975 1977 1979 1981 1983 1985 1987 1989 1991 1993 1995 1997 1999 2001 2003 2005 2007 2009 2011 2013 2015 2017 2019 2021 1970 1972 1974 1976 1978 1980 1982 1984 1986 1988 1990 1992 1994 1996 1998 2000 2002 2004 2006 2008 2010 2012 2014 2016 2018 2020 2022 HD PD TX (For actual numbers in Fig 1.1.1, refer to Appendix T1.1.1)
Table 1.1.2: Stock and flow of ESKD Patients on KRT at 31st Dec, Table 1.1.2: Stock and flow of ESKD Patients on KRT at 31st Dec, Malaysia 2012 Malaysia 2012- -2022 2022 Year Dialysis Patients HD Patients PD Patients Transplant Patients Dialysis Rate, pmp HD Rate, pmp PD Rate, pmp Transplant Rate, pmp HD, % PD, % Tx, % 2022 51256 50340 50376 47569 44919 42763 40837 38167 35193 32378 29452 45045 44443 44853 42581 40343 38464 36850 34378 31889 29513 26881 6211 5897 5523 4988 4576 4299 1908 1821 1872 1852 1806 1829 1568 1536 1556 1489 1425 1375 1378 1356 1386 1333 1280 1237 190 180 171 156 145 138 58 56 58 58 57 59 84.7 85.2 85.8 86.2 86.3 86.3 11.7 11.3 10.6 10.1 9.8 9.6 3.6 3.5 3.6 3.7 3.9 4.1 2021 2020 2019 2018 2017 2016 2015 2014 2013 2012 3987 1811 1331 1201 130 59 86.4 9.3 4.2 3789 1839 1261 1136 125 61 85.9 9.5 4.6 3304 1856 1178 1068 111 62 86.1 8.9 5 2865 1894 1099 1001 97 64 86.1 8.4 5.5 2571 1911 1013 925 88 66 85.7 8.2 6.1
Figure 1.1.2(a): Prevalence of treated ESKD patients by modality Figure 1.1.2(a): Prevalence of treated ESKD patients by modality (On KRT at 31st Dec), Malaysia 1969 (On KRT at 31st Dec), Malaysia 1969- -2022 2022 55,000 50,000 45,000 40,000 No. of patients 35,000 30,000 25,000 20,000 15,000 10,000 5,000 0 1969 1971 1973 1975 1977 1979 1981 1983 1985 1987 1989 1991 1993 1995 1997 1999 2001 2003 2005 2007 2009 2011 2013 2015 2017 2019 2021 1970 1972 1974 1976 1978 1980 1982 1984 1986 1988 1990 1992 1994 1996 1998 2000 2002 2004 2006 2008 2010 2012 2014 2016 2018 2020 2022 HD PD TX (For actual numbers for Fig 1.1.2, refer to Appendix T1.1.2)
Figure 1.1.2(b): Proportion of treated prevalent ESKD patients by Figure 1.1.2(b): Proportion of treated prevalent ESKD patients by modality (On KRT at 31st Dec), Malaysia 1969 modality (On KRT at 31st Dec), Malaysia 1969- -2022 2022 100 95 90 85 80 Porportion of patients (%) 75 70 65 60 55 50 45 40 35 30 25 20 15 10 5 0 1969 1971 1973 1975 1977 1979 1981 1983 1985 1987 1989 1991 1993 1995 1997 1999 2001 2003 2005 2007 2009 2011 2013 2015 2017 2019 2021 1970 1972 1974 1976 1978 1980 1982 1984 1986 1988 1990 1992 1994 1996 1998 2000 2002 2004 2006 2008 2010 2012 2014 2016 2018 2020 2022 HD PD TX (For actual numbers for Fig 1.1.2, refer to Appendix T1.1.2)
Figure 1.2.1: Incidence rate of newly treated ESKD patients (per Figure 1.2.1: Incidence rate of newly treated ESKD patients (per million population) by modality (New Dialysis and New million population) by modality (New Dialysis and New Transplant), Malaysia 1969 Transplant), Malaysia 1969- -2022 2022 300 280 Incidence Rate, per million population 260 240 220 200 180 160 140 120 100 80 60 40 20 0 1969 1970 1971 1972 1973 1974 1975 1976 1977 1978 1979 1980 1981 1982 1983 1984 1985 1986 1987 1988 1989 1990 1991 1992 1993 1994 1995 1996 1997 1998 1999 2000 2001 2002 2003 2004 2005 2006 2007 2008 2009 2010 2011 2012 2013 2014 2015 2016 2017 2018 2019 2020 2021 2022 HD PD TX (For actual numbers in Fig 1.2.1, refer to Appendix T1.1.1)
Figure 1.2.2: Prevalence rate of treated ESKD patients (per Figure 1.2.2: Prevalence rate of treated ESKD patients (per million population) by modality (On KRT at 31st Dec), Malaysia million population) by modality (On KRT at 31st Dec), Malaysia 1969 1969- -2022 2022 1,700 Prevalence Rate, per million population 1,600 1,500 1,400 1,300 1,200 1,100 1,000 900 800 700 600 500 400 300 200 100 0 1969 1971 1973 1975 1977 1979 1981 1983 1985 1987 1989 1991 1993 1995 1997 1999 2001 2003 2005 2007 2009 2011 2013 2015 2017 2019 2021 1970 1972 1974 1976 1978 1980 1982 1984 1986 1988 1990 1992 1994 1996 1998 2000 2002 2004 2006 2008 2010 2012 2014 2016 2018 2020 2022 HD PD TX (For actual numbers in Fig 1.2.2, refer to Appendix T1.1.2)
Table 1.2.1: Kidney transplant rate per 1000 dialysis patients, Table 1.2.1: Kidney transplant rate per 1000 dialysis patients, 1969 1969- -2022 2022 Kidney transplant rate per 1000 dialysis patients 4.1 1.6 3 3.3 2.2 2.6 2.2 3 2.6 3.1 3.7 4.9 5.4 6.6 6.8 6.6 10.1 12.9 Kidney transplant rate per 1000 dialysis patients 16.4 15.3 18.9 20.8 21.6 22.9 23.3 34.8 51.6 46.9 116.4 99.6 101.2 121.2 150.4 136.3 144.9 122.7 Kidney transplant rate per 1000 dialysis patients 90.9 114.1 81.6 120.5 209.4 206.6 535.7 793.1 333.3 263.2 400 62.5 0 62.5 0 0 0 0 Number of new transplant recipients Number of prevalent dialysis patients Number of new transplant recipients Number of prevalent dialysis patients Number of new transplant recipients Number of prevalent dialysis patients Year Year Year 2022 2021 2020 2019 2018 2017 2016 2015 2014 2013 2012 2011 2010 2009 2008 2007 2006 2005 212 80 153 159 98 112 89 114 91 100 108 130 128 142 133 113 153 173 51256 50340 50376 47569 44919 42763 40837 38167 35193 32378 29452 26486 23826 21667 19453 17132 15118 13381 2004 2003 2002 2001 2000 1999 1998 1997 1996 1995 1994 1993 1992 1991 1990 1989 1988 1987 194 160 172 163 145 127 106 129 151 105 203 139 119 117 125 95 91 66 11862 10426 9122 7849 6710 5555 4551 3708 2925 2237 1744 1396 1176 965 831 697 628 538 1986 1985 1984 1983 1982 1981 1980 1979 1978 1977 1976 1975 1974 1973 1972 1971 1970 1969 42 46 27 30 40 25 30 23 8 5 6 1 0 1 0 0 0 0 462 403 331 249 191 121 56 29 24 19 15 16 19 16 17 15 18 12
Figure 1.2.3: Kidney transplant rate per 1000 dialysis patients, Figure 1.2.3: Kidney transplant rate per 1000 dialysis patients, Malaysia 1969 Malaysia 1969 2022 2022 800 Kidney transplant rate per 1000 dialysis patients 750 700 650 600 550 500 450 400 350 300 250 200 150 100 50 0 1969 1971 1973 1975 1977 1979 1981 1983 1985 1987 1989 1991 1993 1995 1997 1999 2001 2003 2005 2007 2009 2011 2013 2015 2017 2019 2021 1970 1972 1974 1976 1978 1980 1982 1984 1986 1988 1990 1992 1994 1996 1998 2000 2002 2004 2006 2008 2010 2012 2014 2016 2018 2020 2022 (For actual numbers in Fig 1.2.3, refer to Appendix T1.2.3)
Figure 1.2.4: Kidney transplant rate per 1000 dialysis patients in Figure 1.2.4: Kidney transplant rate per 1000 dialysis patients in ln, Malaysia 1969 ln, Malaysia 1969 2022 2022 Kidney transplant rate per 1000 dialysis patients (in Ln) 7 6.5 6 5.5 5 4.5 4 3.5 3 2.5 2 1.5 1 .5 0 1969 1971 1973 1975 1977 1979 1981 1983 1985 1987 1989 1991 1993 1995 1997 1999 2001 2003 2005 2007 2009 2011 2013 2015 2017 2019 2021 1970 1972 1974 1976 1978 1980 1982 1984 1986 1988 1990 1992 1994 1996 1998 2000 2002 2004 2006 2008 2010 2012 2014 2016 2018 2020 2022


: Number of new KRT patients by modality (New")
: Proportion of new KRT patients by modality")

: Prevalence of treated ESKD patients by")
: Proportion of treated prevalent ESKD")