Confidence Intervals and Interval Estimation in Statistics
Understanding how to compute confidence intervals is crucial in statistics to estimate parameters accurately. Confidence intervals are constructed based on sample size, mean estimate, estimated standard error, and chosen level of confidence. Using the Student-T distribution for sampling distribution assumption, one can compute confidence intervals for population means. An example of computing a 99% two-sided confidence interval for a given data set is demonstrated.

Download Presentation

Please find below an Image/Link to download the presentation.
The content on the website is provided AS IS for your information and personal use only. It may not be sold, licensed, or shared on other websites without obtaining consent from the author. Download presentation by click this link. If you encounter any issues during the download, it is possible that the publisher has removed the file from their server.
E N D
Presentation Transcript
Interval Estimation 2 Computing Confidence Intervals
Confidence Intervals So how do we compute a (1 ) 100% confidence interval given a set of data?? Conceptually, if we are trying to estimate a parameter with some estimator we have to know something about the sampling distribution of the estimator For large IID samples, one can show that is approximately normal: Approx. sampling dist. of an estimator (large IID sample assumed)
Confidence Intervals To explicitly take sample size, n, into account (and thus be more conservative), instead use the student-T distribution: Approx. sampling dist. of an estimator (IID sample of size n) We will use the Student-T assumption for the sampling distribution by default
Intuition: Student-t vs Normal Sampling Dists Normal distribution Student-t distribution Fatter in the tails
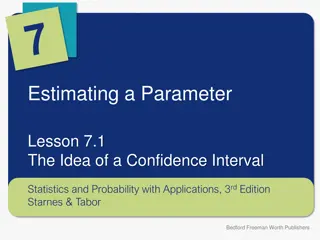
Intuition: Student-t and tc Student-t PDF, d.f. = 3 Area = Area = 0.95 0.99 5.84 -5.84 3.18 -3.18 tc = 3.18 for (two-sided) 95% confidence tc = 5.84 for (two-sided) 99% confidence
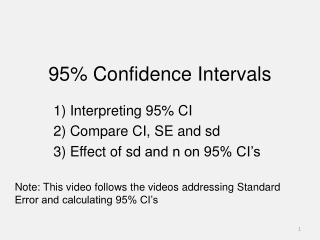
Confidence Intervals Construction of a CI for a mean depends on: Sample size n Mean estimate Estimated standard error for the mean Level of confidence 1- is significance level Use to compute tc-value (1- ) 100% CI for population mean using a sample average and standard error is:
Example: Confidence Intervals Compute a 99% two sided confidence interval for the the RI of a glass shard using this sample set: Fragment # Fragment nD 1 2 3 4 5 6 7 8 9 10 11 1.52005 1.52003 1.52001 1.52004 1.52000 1.52001 1.52008 1.52011 1.52008 1.52008 1.52008 ?
Example: Confidence Intervals # Data x <- c(1.52005,1.52003,1.52001,1.52004,1.52000,1.52001, 1.52008,1.52011,1.52008,1.52008,1.52008) n <- length(x) # Estimate of parameter: mu.hat <- mean(x) # Standard deviation of the data sdx.hat <- sd(x) # Standard error of the mean estimate se.hat <- sd(x)/sqrt(n) # Compute tc for given sample size and chosen confidence level conf <- 0.99 alpha <- 1-conf tc <- qt(1 - alpha/2, df = n-1) # Put the CI together: mu.hat.lo <- mu.hat - tc*se.hat mu.hat.hi <- mu.hat + tc*se.hat c(mu.hat.lo, mu.hat.hi)
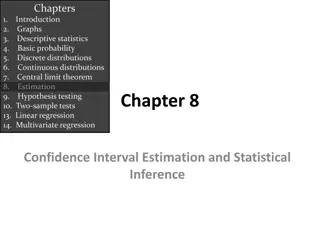
Example: Confidence Intervals Approx. Sampling Distribution for Mean 1.520087 99% Confidence 1.520017
Example: Confidence Intervals Compute a 99% two sided confidence interval for the the RI of a glass shard using this sample set: Fragment # Fragment nD 1 2 3 4 5 6 7 8 9 10 11 1.52005 1.52003 1.52001 1.52004 1.52000 1.52001 1.52008 1.52011 1.52008 1.52008 1.52008 Putting this together: [1.520052 - (3.17)(0.00001), 1.520052 + (3.17)(0.00001)] 99% CI for sample = [1.520017, 1.520087]
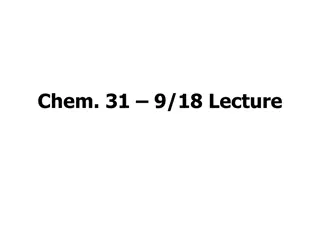
Another Exercise A suspect, one Mr. B. Mayhew is captured by law enforcement officials in possession of many mini-Ziploc baggies containing what is determined to be very pure, dry methamphetamine. The forensic lab s analytical balances are reliable to 4-decimal places. The baggies are emptied and collected into one mass of crystals. 10 mass measurements are taken (units g): 49.9996, 49.9994, 49.9993, 49.9996, 49.9995, 49.9995, 49.9995, 49.9994, 49.9995, 49.9994 a. Compute the one-sided 95% CI for the lower bound on the mean mass b. Compute the one-sided 95% CI for the upper bound on the mean mass c. Sketch pictures of where these CIs would appear on the approximate sampling distribution for the meth s mass
# Data for Mr. Mayhew's seizure: x <- c(49.9996,49.9994,49.9993,49.9996,49.9995, 49.9995,49.9995,49.9994,49.9995,49.9994) n <- length(x) # a. **One-sided lower bound. The assumed "upper limit" is Infinity # Estimate of mean: mu.hat <- mean(x) # Estimate of the standard deviation of the data sdx.hat <- sd(x) # Standard error of the mean estimate se.hat <- sd(x)/sqrt(n) # Compute tc for given sample size and chosen confidence level conf <- 0.95 alpha <- 1-conf tc <- qt(1 - alpha, df = n-1) # **This is the big change. # Now we don't split the alpha between the tails. # For the lower bound we put all the alpha on # the lower tail. Therefore -tc! # Put the One-sided lower bound CI together: mu.hat.lo <- mu.hat - tc*se.hat c(mu.hat.lo, Inf) # b. **One-sided upper bound. The assumed "lower limit" is -Infinity # Everything is the same except now we put all the alpha in the upper tail. mu.hat.hi <- mu.hat + tc*se.hat c(-Inf, mu.hat.hi)
Another Exercise 49.99952 49.99942 95% Confidence 95% Confidence One sided, upper bound One sided, lower bound