Enhancing Air Quality Monitoring Through Multi-Pollutant Fusion System
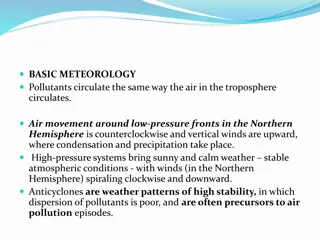
AirFuse EPA's multi-pollutant fusion system, developed by Barron H. Henderson, Phil Dickerson, and co-authors, integrates data from AirNow, PurpleAir sensors, and satellites to improve air quality predictions. The system leverages real-time monitoring, satellite observations, and correction models to enhance the accuracy of PM2.5 estimations and forecast models, benefiting public health and regulatory purposes. Various studies highlight the effectiveness of fusion techniques in combining sensor data and satellite observations to create a comprehensive national-scale air quality monitoring system.

Download Presentation

Please find below an Image/Link to download the presentation.
The content on the website is provided AS IS for your information and personal use only. It may not be sold, licensed, or shared on other websites without obtaining consent from the author. Download presentation by click this link. If you encounter any issues during the download, it is possible that the publisher has removed the file from their server.
E N D
Presentation Transcript
AirFuse EPA s multi-pollutant fusion system Barron H. Henderson and Phil Dickerson Co-authors: Pawan Gupta, Shobha Kondragunta, Alqamah Sayeed, Hai Zhang, Janica Gordon, Halil Cakir, Brett Gantt, Benjamin Wells, and HAQAST AirNow Team Disclaimer: The views expressed in this presentation are those of the authors and do not necessarily reflect the views or policies of the U.S. Environmental Protection Agency. 1
Example Day in AirNow and Aerosol Watch Motivation AirNow communicates air quality in real time Millions of visitors per day during fire seasons Simple weighted (d-5) contours monitors only 4x more PurpleAir sensors than monitors Increased the spatial coverage of monitored particulate matter. Spoiler alert: sensor data improves predictions. Near-real-time satellite observations Recent development by NOAA/NESDIS/STAR NASA HAQAST project connecting AirNow to NOAA geostationary satellite data What about fusing AirNow, PurpleAir and satellites? Yellow in between green monitors must be from fusion. 2023-06-14 11:53 2
Fire and Smoke Map Way more in RTP Monitors and PurpleAir sensors Many agencies report monitor data to AirNow ~1000 reporting monitors per hour Publicly available thru AirNowAPI Schulte et al (2020) using PurpleAir Residual Kriging with both AirNow and PurpleAir NOAA Forecast model Model Correction : Y = Mn - Krig(Mn On) Improved performance of PM2.5 in leave-one-out validation and compared to Federal Reference Monitors We use corrected PurpleAir low-cost sensors Barkjohn et al. 2021 developed a national correction Extended correction via RSIG 2x in Greensboro Better RMSE in Los Angeles Schulte et al 2020 (10.1088/1748-9326/abb62b) 3
GOES-PM25 https://haqast.org/tiger-teams/#2021-tiger-teams DNN Bias Correction 1.Sayeed et al: Deep Neural Network bias corrections. 2.O'Dell et al.: Public Health Benefits from Improved Identification of Severe Air Pollution Events with Geostationary Satellite Data, submitted to GeoHealth, 2023. 3.Zhang et al.: Nowcasting Applications of Geostationary Satellite Hourly Surface PM2.5 Data. Weather and Forecasting, 37(12), 2313-2329, 2022. doi: 10.1175/WAF-D-22-0114.1 4.Bratburd et al.: Air Quality Data When You Need It: Incorporating Satellite Data Updates into AirNow, EM Plus, 2022. 5.Zhang and Kondragunta.: Daily and Hourly Surface PM2.5 Estimation From Satellite AOD, Earth Space Sci, 8, doi: 10.1029/2020EA001599, 2021. Hourly product with gaps 4
Hourly National-scale Fusion Ensemble Interpolating bias to correct the forecast model* NOAA s Forecast Model (NAQFC) as mediating layer VNA Bias = sum(dn-2 (mn - on)) / sum(dn-2) Yi = NAQFC VNA Biasi One layer from AirNow (YAN) observations: mostly regulatory grade hourly observations paired with collocated grid cell. n = Voronoi Neighbor NAQFC VNA Bias *A multiplicative corrector of this type is called extended VNA (eVNA) **Piece-wise regression as in Fire and Smoke Map Bias Corrected 5
Hourly National-scale Fusion Ensemble Interpolating bias to correct the forecast model* NOAA s Forecast Model (NAQFC) as mediating layer VNA Bias = sum(dn-2 (mn - on)) / sum(dn-2) Yi = NAQFC VNA Biasi One layer from AirNow (YAN) observations: mostly regulatory grade hourly observations paired with collocated grid cell. One layer from PurpleAir (YPA) observations: low-cost sensor hourly observations with calibration** Aggregated within grid cells to create a pseudo-observation n = Voronoi Neighbor NAQFC VNA Bias *A multiplicative corrector of this type is called extended VNA (eVNA) **Piece-wise regression as in Fire and Smoke Map Bias Corrected 6
Hourly National-scale Fusion Ensemble Interpolating bias to correct the forecast model* NOAA s Forecast Model (NAQFC) as mediating layer VNA Bias = sum(dn-2 (mn - on)) / sum(dn-2) Yi = NAQFC VNA Biasi One layer from AirNow (YAN) observations: mostly regulatory grade hourly observations paired with collocated grid cell. One layer from PurpleAir (YPA) observations: low-cost sensor hourly observations with calibration** Aggregated within grid cells to create a pseudo-observation One layer from GOES-PM25 (YGOES) observations Geostationary Operational Environmental Satellite (GOES) Aerosol Optical Depth from the GOES Advanced Baseline Imager Geographic Weighted Regression (GWR) against AirNow Deep Neural Network Corrected (Sayeed et al in prep) n = Voronoi Neighbor NAQFC VNA Bias *A multiplicative corrector of this type is called extended VNA (eVNA) **Piece-wise regression as in Fire and Smoke Map Bias Corrected 7
Ensemble Averaging Method Simple fusion of bias corrected surfaces NAQFC, AirNow, PurpleAir, GOES-PM25 Fuse the surfaces based on distance Apply different weights to ensembles YAN,PA,GOES = ANYAN + PAYPA + GOESYGOES 'AN = (1 x dAN)-2 'PA = (2 x dPA)-2 'GOES = (10 x dGOES)-2 'tot= 'AN + 'PA+ 'GOES Normalize them all: i = 'i / 'tot YAN,PA,GOES = x YAN,PA,GOES + (1 - ) x YNAQFC 8
Interpolated Bias Bias Corrected Weights Monitors Case Study 2023-06-14T17Z Fairly typical day June day in the south western domain. PurpleAir Large fire contributions in Canada and sweeping down through Minnesota, Wisconsin and further 4 data sources AirNow Monitors (top) PurpleAir sensors GOES PM25 NAQFC (bottom) GOES PM25 Estimates Bias Corrections NAQFC Full fusion Full fusion 9
Los Angeles: 2023-06-14T17Z NAQFC yAN yPA yGOES yFUSED IDW(AN) 10
Canadian Wildfires: 2023-06-14T17Z yPA yAN NAQFC yFUSED yGOES IDW(AN) 11
Canadian Wildfires: 2023-06-14T17Z yPA yAN NAQFC yFUSED yGOES IDW(AN) 12
Canadian Wildfires: 2023-06-14T17Z yPA yAN NAQFC yFUSED yGOES IDW(AN) 13
Evaluating the approach That was just one hour Applied daylight from Jun 2023 to Sept 2023 IDW as in AirNow (*) NAQFC from NOAA (*) Corrected w/ AirNow: AN Correction w/ AN and PurpleAir: AN+PA Correction w/ AN, PA and GOES: AN+PA+GOES Predicted each AirNow monitor without that monitor in the fusion n=1.3M = 12 h/d * 30 d/m * 3.75m * 1000 /h Statistics: Normalized Mean Bias, Normalized Mean Error, RMSE, Correlation. 14
Performance Summary: June-Sept 2023 (daylight hours; n=1.3M) Multiple statistics matter Pearson correlation (y-axis) centered Root Mean Squared Error (x- axis) Reproduction of standard deviation The NAQFC has the lowest correlation, the highest RMSE, and the worst standard deviation. The AirNow and IDW have similar correlation, AirNow has better standard deviation. The fusion with PurpleAir improves standard deviation, correlation, and root mean squared error. The fusion with GOES is even better. 15
Performance Summary: June 2021-June 2022 (All hours; n=8M) Multiple statistics matter Pearson correlation (y-axis) centered Root Mean Squared Error (x- axis) Reproduction of standard deviation The NAQFC has the lowest correlation, the highest RMSE, and the worst standard deviation. The AirNow and IDW have similar correlation, AirNow has better standard deviation. The fusion with PurpleAir improves standard deviation, correlation, and root mean squared error. Is the story more complex? When does one fail and the other succeeds? 16
Leave-1-out Validation: National Average of Predictions This figure summarizes the concentration of PM2.5 over the months of the year by method. All methods peak during the fire season with the NAQFC peaking during July. Whereas the observations and other methods all peak during August. Remember, this is validation. In application, the prediction at the monitor is equal to the monitor. 17
Leave-1-out Validation: National Correlation Incorporating PA improves the correlation especially during the fire season. aVNA(AN) has lowest correlation overall. aVNA(AN,PA) improves the correlation over the time of day. Remember, this is validation. In application, the prediction at the monitor is equal to the monitor. 18
Leave-1-out Validation: National Correlation Incorporating PA improves the correlation especially during the fire season. aVNA(AN) has lowest correlation overall. aVNA(AN,PA) improves the correlation over the time of day. Remember, this is validation. In application, the prediction at the monitor is equal to the monitor. 19
Leave-1-out Validation: National Mean Bias oIDW and aVNA(AN) have the most consistent bias. aVNA(AN,PA) has highest bias at night but is still quite good. Currently, we use a single bias correction for PurpleAir. Humidity varies with time of day and may need more complex correction. Also, FEM technologies are evaluated most strictly for daily average concentration. Remember, this is validation. In application, the prediction at the monitor is equal to the monitor. 20
Summary AirNow needs an updated interpolation method. EPA has long used models and statistical fusion to fill gaps with regulatory but has not incorporated these methods into AirNow. Schulte et al. demonstrated including models and PurpleAir improved on simple interpolations and applied it in an AirNow-like system. HAQAST Tiger Team evaluated GOES PM25 for real-time-applications. Fusion with PurpleAir is ready. Discontinuities are less stark than GOES because datasets are more spatially consistent (ie sparse in the same places). Value of PurpleAir is obvious because they are dense near monitors. Fusion with GOES PM25 ongoing work HAQAST Tiger Team 2021 (Gupta) now 2023 (Yang Liu) Conceptually, the satellite value is highest away from monitors and sensors making it hard to evaluate ~5% of monitors are further than 30km from their nearest withheld monitor 21
Questions? henderson.barron@epa.gov 22
Extra Slides henderson.barron@epa.gov 23
Evaluating the approach That was just one hour Applied hourly data from Jun 2021 to Jun 2022 IDW as in AirNow (*) NAQFC from NOAA (*) Corrected w/ AirNow: AN Correction w/ AN and PurpleAir: AN+PA Correction w/ AN, PA and GOES: AN+PA+GOES Predicted each AirNow monitor without that monitor in the fusion n=8M = 8760 h/y * 1000 /h Statistics: Normalized Mean Bias, Normalized Mean Error, RMSE, Correlation. 24
Alternative Ensemble Weighting Approaches We need a method to synthesize the products: At this point, we have a potential of 4 fusion products 2 bias correction methods (aVNA, eVNA), 2 data sources (AirNow, PurpleAir) Geographically Varying Weights (GVW) Similar to Requia[1], but implemented like Skipper[2] Yfused = i iYi i = ci + i,0x + i,1y + i,2dPA + i,2dAN ci and all are fit using least squares regression Random Forest Regression (RF) Features: x, y, dPA, dAN, Yi estimates from leave-one-out cross-validation Configuration: Minimum 20 features for a split; 100 trees. Not Shown: Few day tests show Both GVW and RF have better correlation than current approach; RF best. But . Current approach has better standard deviation than either This will likely need to be revisited when bringing in the GOES-PM25. [1] Requia et al. https://pubs.acs.org/doi/10.1021/acs.est.0c01791 [2] Skipper et al. https://doi.org/10.1021/acs.est.0c08625 25
Leave-1-out Validation: National Mean Bias GOES shows structure in the bias that is associated with long- distance extrapolation The fusion actually doesn t use those cells (too far away) Remember, this is validation. In application, the prediction at the monitor is equal to the monitor. 26


")
")