Load Impact Evaluation for Leap's 2021 Demand Response Program

Results of the Load Impact Evaluation for Leap's 2021 Demand Response Program were presented at the Demand Response Providers 2022 Load Impact Protocol Final Report Workshop hosted by the California Public Utilities Commission. The evaluation analyzed the number of meters and events, enrollment details, hourly kWh values, and temperature-dependent forecasts. Additionally, the report includes a comprehensive analysis of the full resource potential for 2021 and predicted load impacts for 2022-2032.
- Load Impact Evaluation
- Demand Response Program
- California Public Utilities Commission
- Resource Potential
- Temperature-Dependent Forecasts

Download Presentation

Please find below an Image/Link to download the presentation.
The content on the website is provided AS IS for your information and personal use only. It may not be sold, licensed, or shared on other websites without obtaining consent from the author. Download presentation by click this link. If you encounter any issues during the download, it is possible that the publisher has removed the file from their server.
E N D
Presentation Transcript
Results of the Load Impact Evaluation for Leap s 2021 Demand Response Program Presented at the Demand Response Providers 2022 Load Impact Protocol Final Report Workshop hosted by the California Public Utilities Commission May 18, 2022 Karen Herter, Ph.D. Jenya Okuneva Sam Borgeson, Ph.D.
Meters and Events in Leaps 2021 Resource Number of Meters Load Type PG&E SCE SDG&E Total Non-residential 512 940 135 1587 Residential 13,666 664 XXX 14332 Number of Events Sector Jan Feb Mar Apr May Jun Jul Aug Sep Oct Nov Dec Non-residential 46 12 5 104 95 152 160 182 218 68 207 197 Residential 0 0 0 0 0 4 5 20 83 7 13 43
Data Data Partner customers Meters Events Enrollment Description Partner ID, site ID, meter ID, enrollment date, site zip code and location, etc. Hourly 2021 kWh values Date and timing of 2021 events High, medium and low enrollment projections Hourly temperature values linked to weather station using latitude and longitude Source Leap Leap Leap Leap National Oceanographic and Atmospheric Administration (NOAA) Temperatures ZIP codes Mapping of zip code to latitude and longitude GeoNames database North American Electric Reliability Corp. (NERC) Holidays, July 2014 Holidays Off-peak weekdays Weather profiles Monthly 1-in-2 and 1-in-10 day profiles Utilities and California ISO
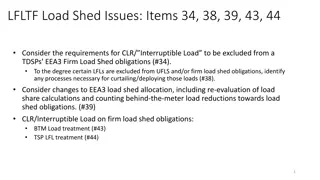
Ex Ex- -post Analysis post Analysis What was the full resource potential for 2021? Meter-specific baselines = N-of-10 or regression model with the lowest error for each meter For each load type and month Load impact estimates with RMSE* below 50% are used High-RMSE* estimates are replaced by the lowest load-impact result in the same season Ex-ante analysis: What are the predicted load impacts for 2022-2032? Fit a mixed-effects model to temperature-dependent meter data (res AC, non-res HVAC) Forecast per-meter baselines for typical and extreme weather scenarios Forecast total demand resource for each load type from 2023 through 2032 How do results differ by sub-LAP and weather? * RMSE = Root Mean Squared Error = the square root of the mean of all errors squared
Ex Ex- -ante Analysis ante Analysis What are the predicted load impacts for 2022-32? Temperature-dependent loads: non-res HVAC, res AC Fit mixed-effects regression models to hourly loads Use coefficients to estimate per-meter loads and baselines by temperature scenario 1-in-2 = Typical future weather scenario* 1-in-10 = Extreme future weather scenario* Non-temperature-dependent loads Assume per-meter load impacts do not change with the weather scenario Use Leap s enrollment forecasts to estimate the 2023-2025 resource By subLAP By load type * The CAISO and utilities use different sets of future weather scenarios for a total of 4 scenarios
Ex-ante Results by Weather Profile 2023 2024 2025-2032 Note: Estimates shown are based on Leap s estimates for moderate participation growth
Ex-ante Results by SubLAP Predicted IOU 1-in-2 August 2023-2032 QC by subLAP PG CC PG EB PG F1 PG FG PG KN PG NB PG NP PG P2 PG SB PG SF PG SI PG ST PG ZP SC EC SC EN SC EW SC HD SC NW SD G1 Year(s) 2023 0.1 0.7 1.4 0.3 1.1 0.3 0.9 0.7 1.2 1.6 0.3 0.4 0.2 18 1.5 2.9 2.0 0.8 98 2024 0.2 0.9 1.8 0.3 1.4 0.4 1.1 0.9 1.5 2.1 0.4 0.5 0.2 22 1.9 3.6 2.5 1.0 146 2025- 2032 0.2 1.2 2.2 0.4 1.8 0.5 1.4 1.1 2.0 2.6 0.5 0.7 0.3 28 2.4 4.6 3.1 1.2 185
Leaps 2023 Qualifying Capacity Values IOU 1-in-2 Weather Conditions (August)
Recommendations Program recommendations Expand efforts to understand which meters are not performing and why Develop educational materials to help low-performing partners improve their response Expand efforts to maximize performance during quarterly full resource tests Protocol / evaluation recommendations Develop a standard protocol for estimating the full ex-post resource Different subsets of meters are dispatched for each event Develop a standard protocol for baseline methods At a minimum, protocols should require meter-specific baselines for heterogeneous loads Develop standard protocols for reducing error in load impact estimates